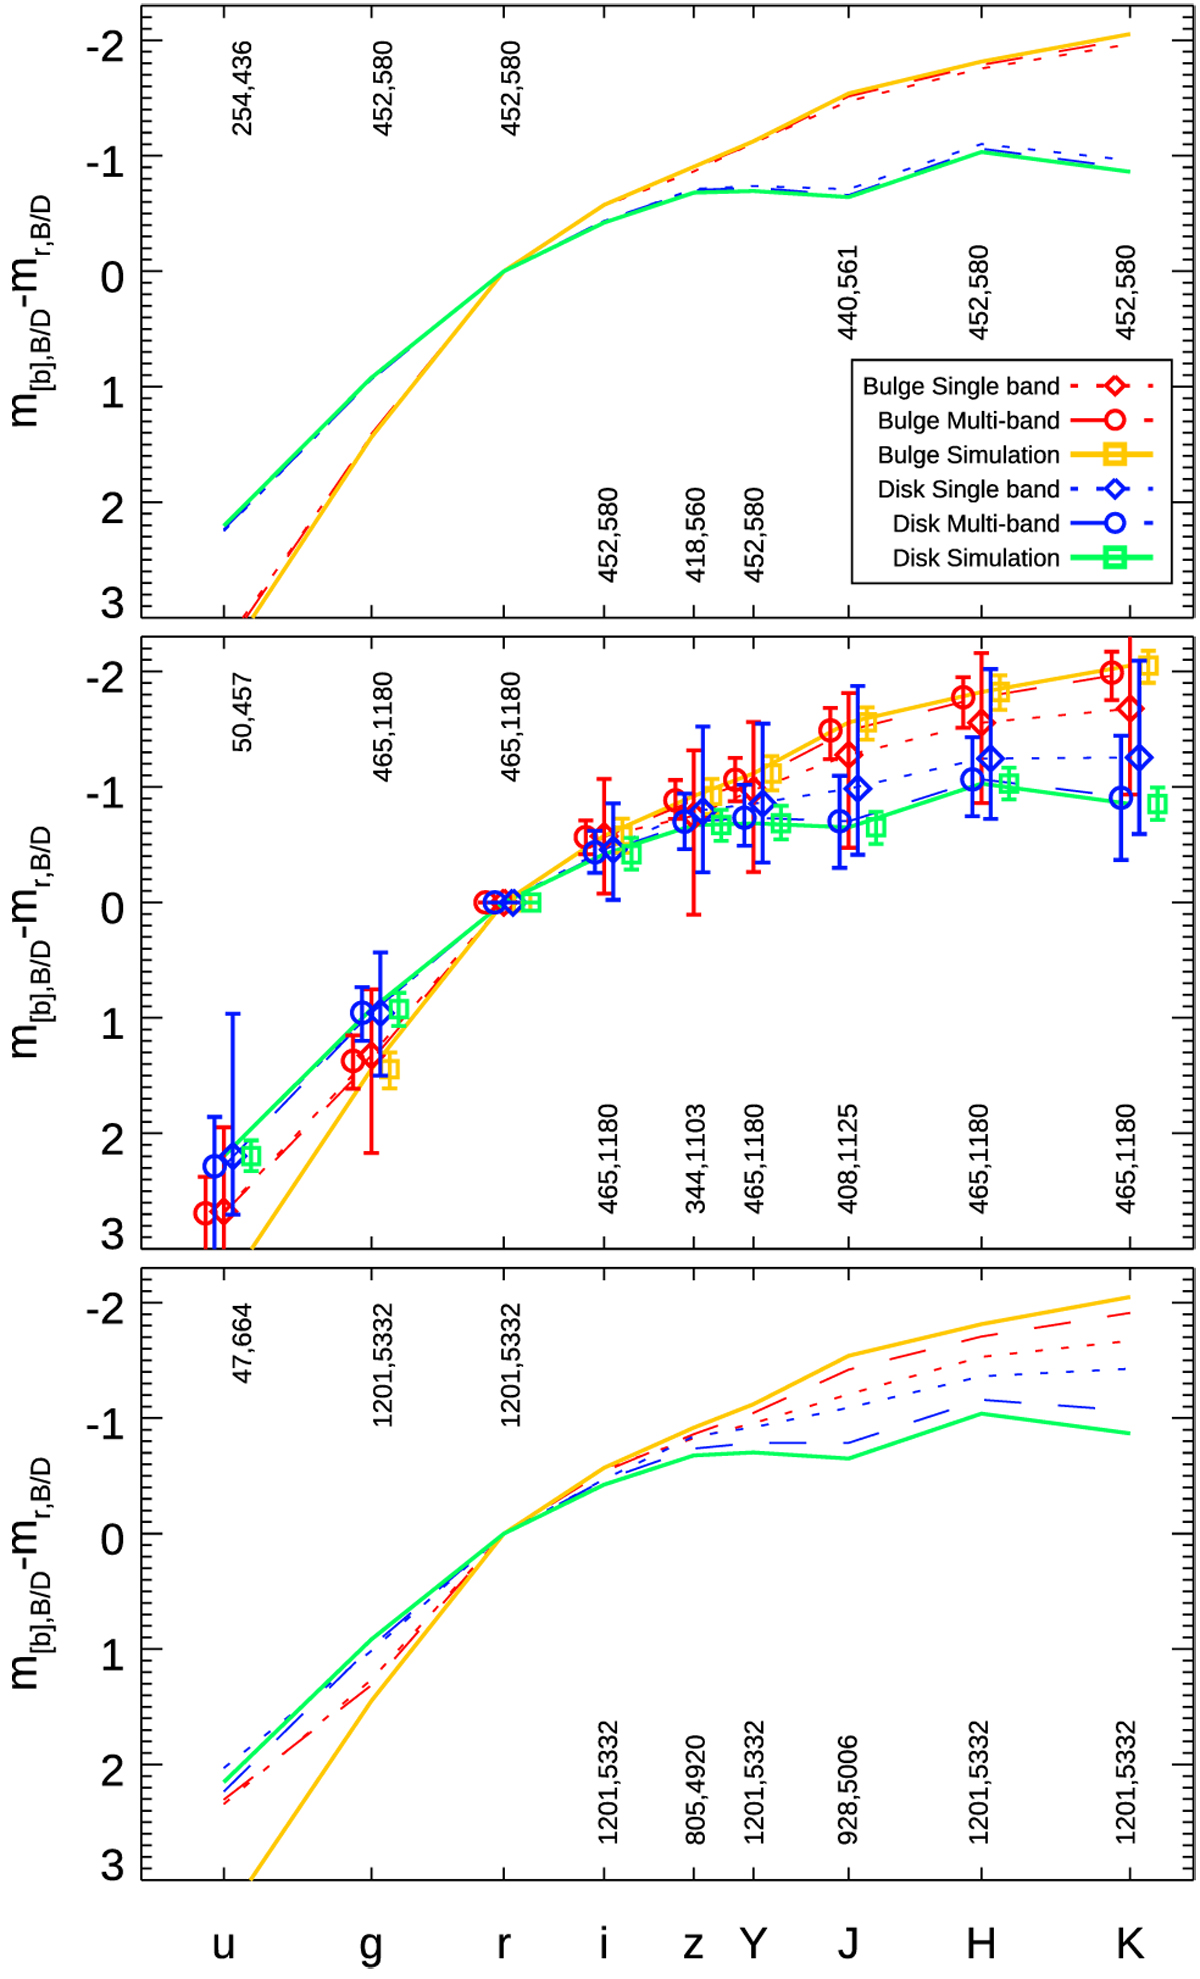
Fig. 12
Download original image
Comparison of colours of individual galaxy components shown as an SED for galaxies of different brightnesses (normalised in the r band). We show the SEDs recovered for galaxies at mr,B+D,sim < 17.5 mag (top), 17.5 < mr,B+D,sim < 18.5 mag (middle), and 18.5 < mr,B+D,sim < 19.5 mag (bottompanel). Numbers at each wavelength indicate the number of objects used in the analysis at that wavelength for bulges and disks, respectively. In the middle panel, error bars for all values are indicated, artificially offset to each other along the x axis. Thick red (bulge) and blue (disk) error bars indicate multi-band fitting and thinner error bars single-band fitting. Orange and green error bars indicate the scatter in the simulated values for bulges and disks, respectively, for comparison. Objects used in this analysis are the biggest possible sample for each data point.
Current usage metrics show cumulative count of Article Views (full-text article views including HTML views, PDF and ePub downloads, according to the available data) and Abstracts Views on Vision4Press platform.
Data correspond to usage on the plateform after 2015. The current usage metrics is available 48-96 hours after online publication and is updated daily on week days.
Initial download of the metrics may take a while.