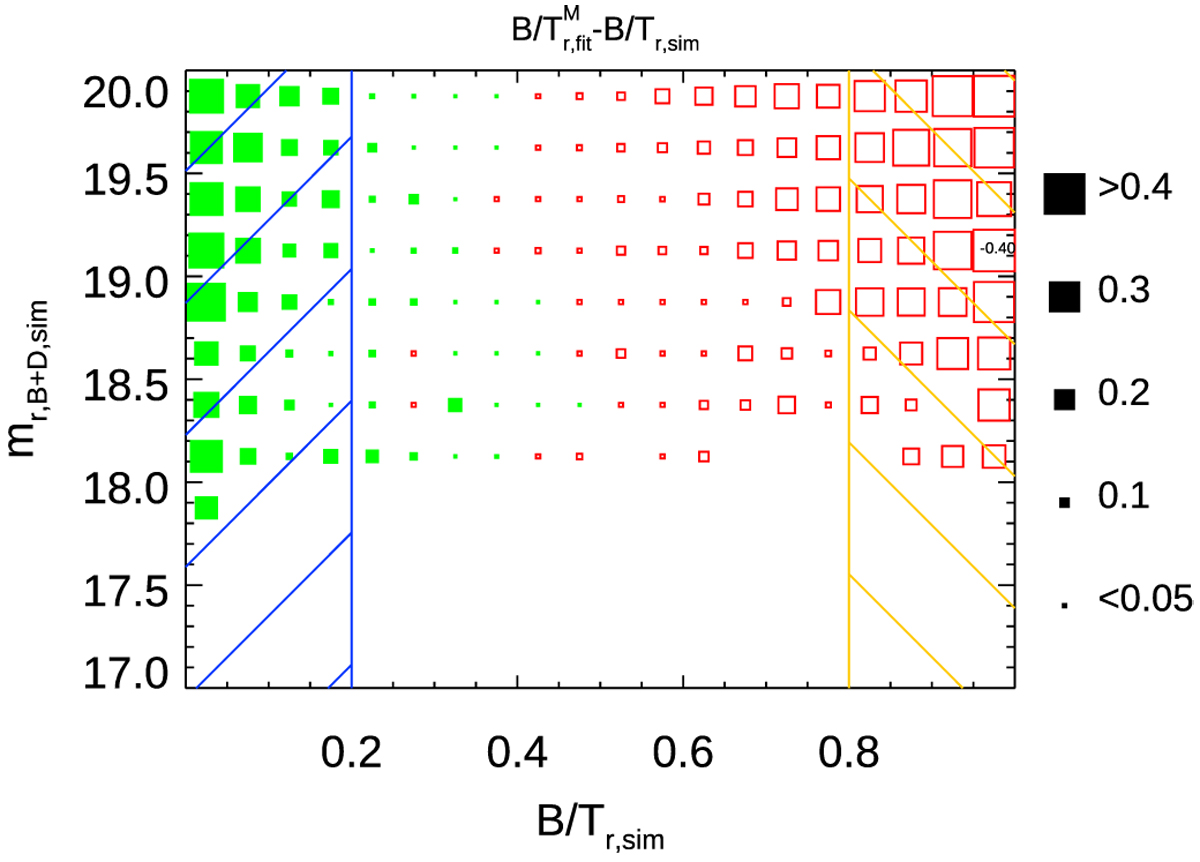
Fig. 11
Download original image
Average difference of recovered and true bulge/total ratios, (B/T)r,fit – (B/T)r,sim, measured in multi-band fits as a function of (B/T)sim and mr,B+D,sim. Sizes of the symbol represent the average offsets between measured and true B/T measured for a given sample, in other words an ideal fit would show no offset (small boxes) over the entire plot range. Green, filled boxes indicate positive values (B/T is overestimated), red, empty boxes indicate negative values. In the range 0.2 < (B/T)sim < 0.8, the measured values agree relatively well with the simulated values. At (B/T)sim < 0.2 and (B/T)sim > 0.8, however, the measured values are systematically biased towards more intermediate values. Only bins with more than 20 objects are shown, to ensure reasonable number statistics in each bin.
Current usage metrics show cumulative count of Article Views (full-text article views including HTML views, PDF and ePub downloads, according to the available data) and Abstracts Views on Vision4Press platform.
Data correspond to usage on the plateform after 2015. The current usage metrics is available 48-96 hours after online publication and is updated daily on week days.
Initial download of the metrics may take a while.