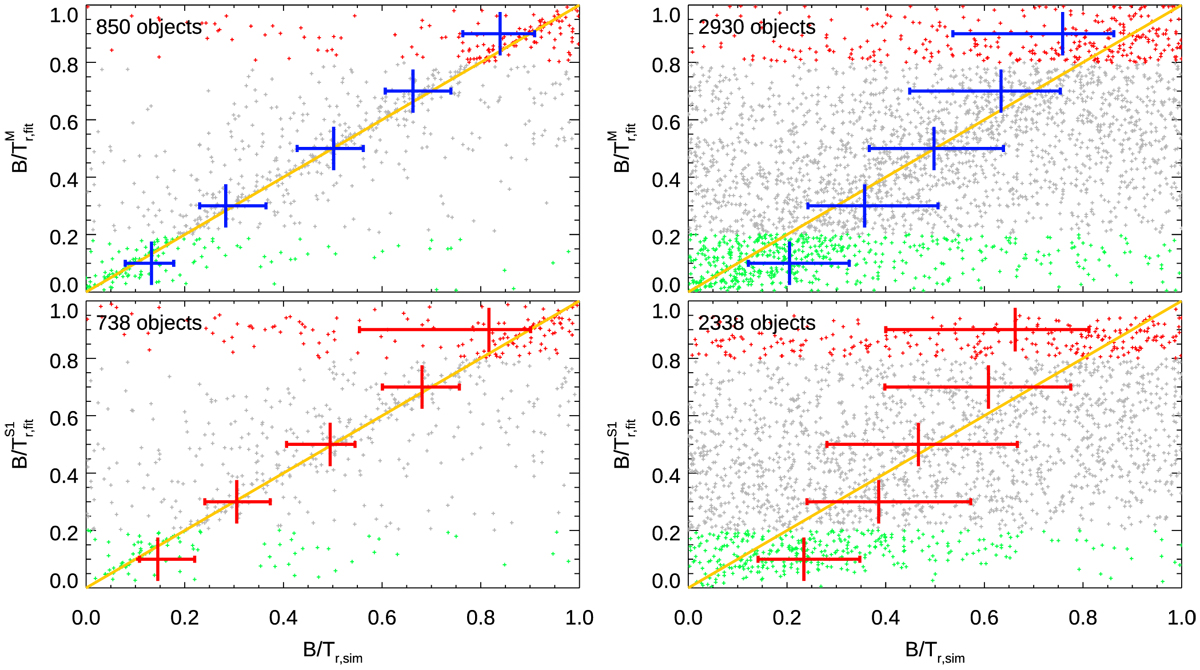
Fig. 10
Download original image
Comparison of input (x axis) and output (y axis) B/T ratios for multi-band fits (top) and single-band fits (bottom), for bright galaxies mr,B+D,sim < 17.5 mag (left) and faint galaxies 18.5 mag < mr,B+D,sim < 19 mag (right). Objects at (B/T)r,fit < 0.2, and (B/T)r,fit > 0.8 are plotted in green and red, respectively, other objects at intermediate B/T in grey. A one-to-one line has been over-plotted to guide the eye. The error bars represent median values and 30/70 percentiles in each bin of 0.2 width in (B/T)r,fit.
Current usage metrics show cumulative count of Article Views (full-text article views including HTML views, PDF and ePub downloads, according to the available data) and Abstracts Views on Vision4Press platform.
Data correspond to usage on the plateform after 2015. The current usage metrics is available 48-96 hours after online publication and is updated daily on week days.
Initial download of the metrics may take a while.