Fig. 1
Download original image
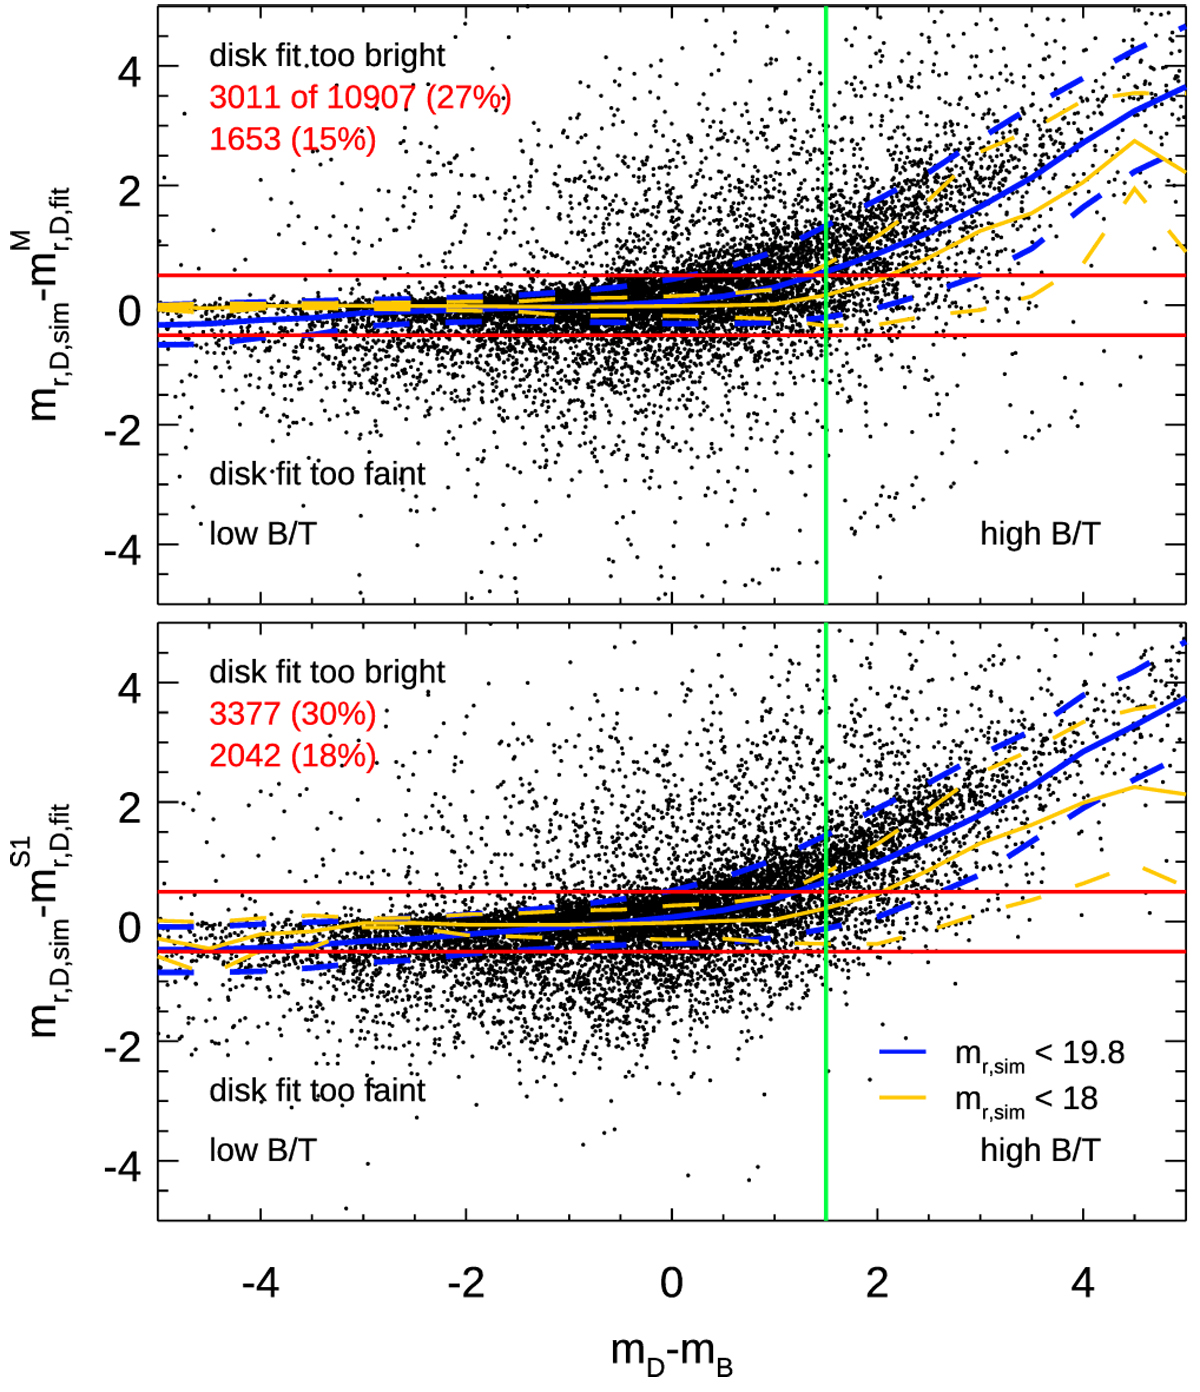
Deviation of fitting to simulated disk r-band magnitude δmr = mr,D,sim − mr,D,fit as a function of the faintness of the disk for objects with mr < 19.8. Top: multi-band fit. Bottom: single-band fit. Here, and in all successive plots, the subscripts of the axis labels indicate [band] plotted where relevant, as well as [B/D] to indicate bulge or disk component and [fit/sim] to indicate fit or simulated value. Where necessary, we also indicate superscripts M or S1 to indicate multi-band or single-band fitting according to the definition in H13. These plots show that the fainter a disk is within a given bulge, the harder it is to fit, as one would expect. Red horizontal lines show an (empirically chosen) allowed deviation of ± 0.5 mag, and red numbers in the top-left corner indicate the number of objects that violate these limits. The systematic trend reaches this limit when the disk is ~1.5 mag fainter than the bulge. Blue lines show the mean deviation and sigma of the relation (robust mean, clipped at 3 sigma), with the same values for objects at mr < 18 indicated in orange.
Current usage metrics show cumulative count of Article Views (full-text article views including HTML views, PDF and ePub downloads, according to the available data) and Abstracts Views on Vision4Press platform.
Data correspond to usage on the plateform after 2015. The current usage metrics is available 48-96 hours after online publication and is updated daily on week days.
Initial download of the metrics may take a while.