Free Access
Fig. 8.
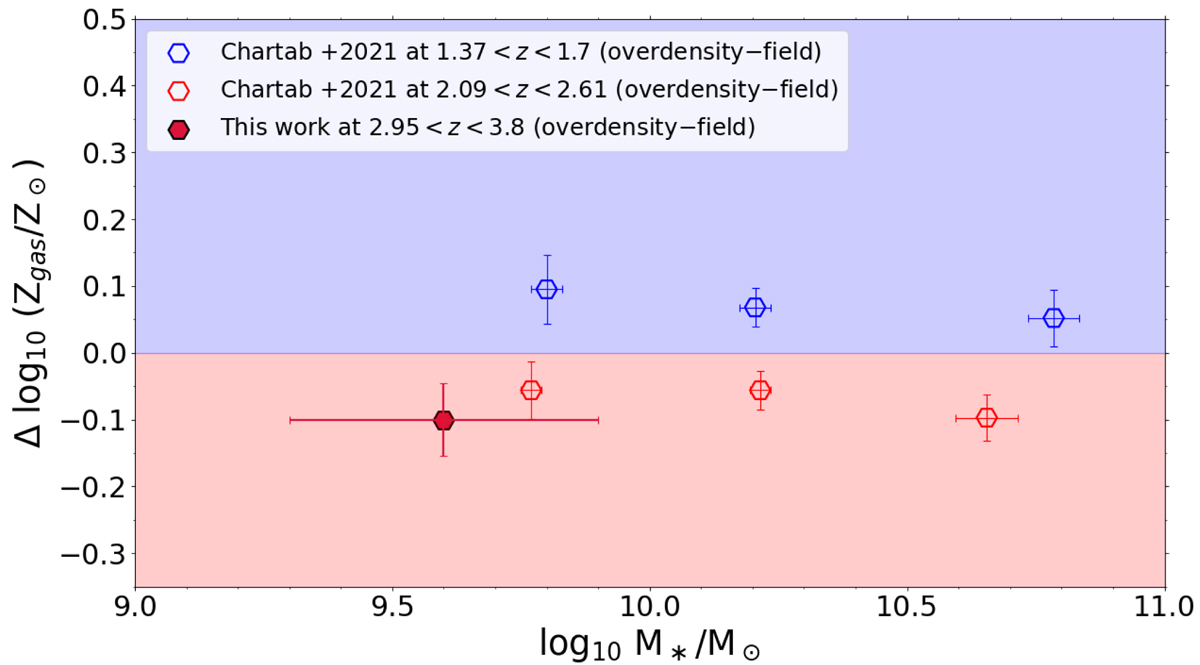
Download original image
Diagram comparing the gas-phase metallicity offset between overdense and underdense regions in the stellar mass range between 108 and 1011 M⊙. Our data is shown as a red solid symbol, overplotted on recent findings from the MOSDEF survey at redshifts below and above 2.
Current usage metrics show cumulative count of Article Views (full-text article views including HTML views, PDF and ePub downloads, according to the available data) and Abstracts Views on Vision4Press platform.
Data correspond to usage on the plateform after 2015. The current usage metrics is available 48-96 hours after online publication and is updated daily on week days.
Initial download of the metrics may take a while.