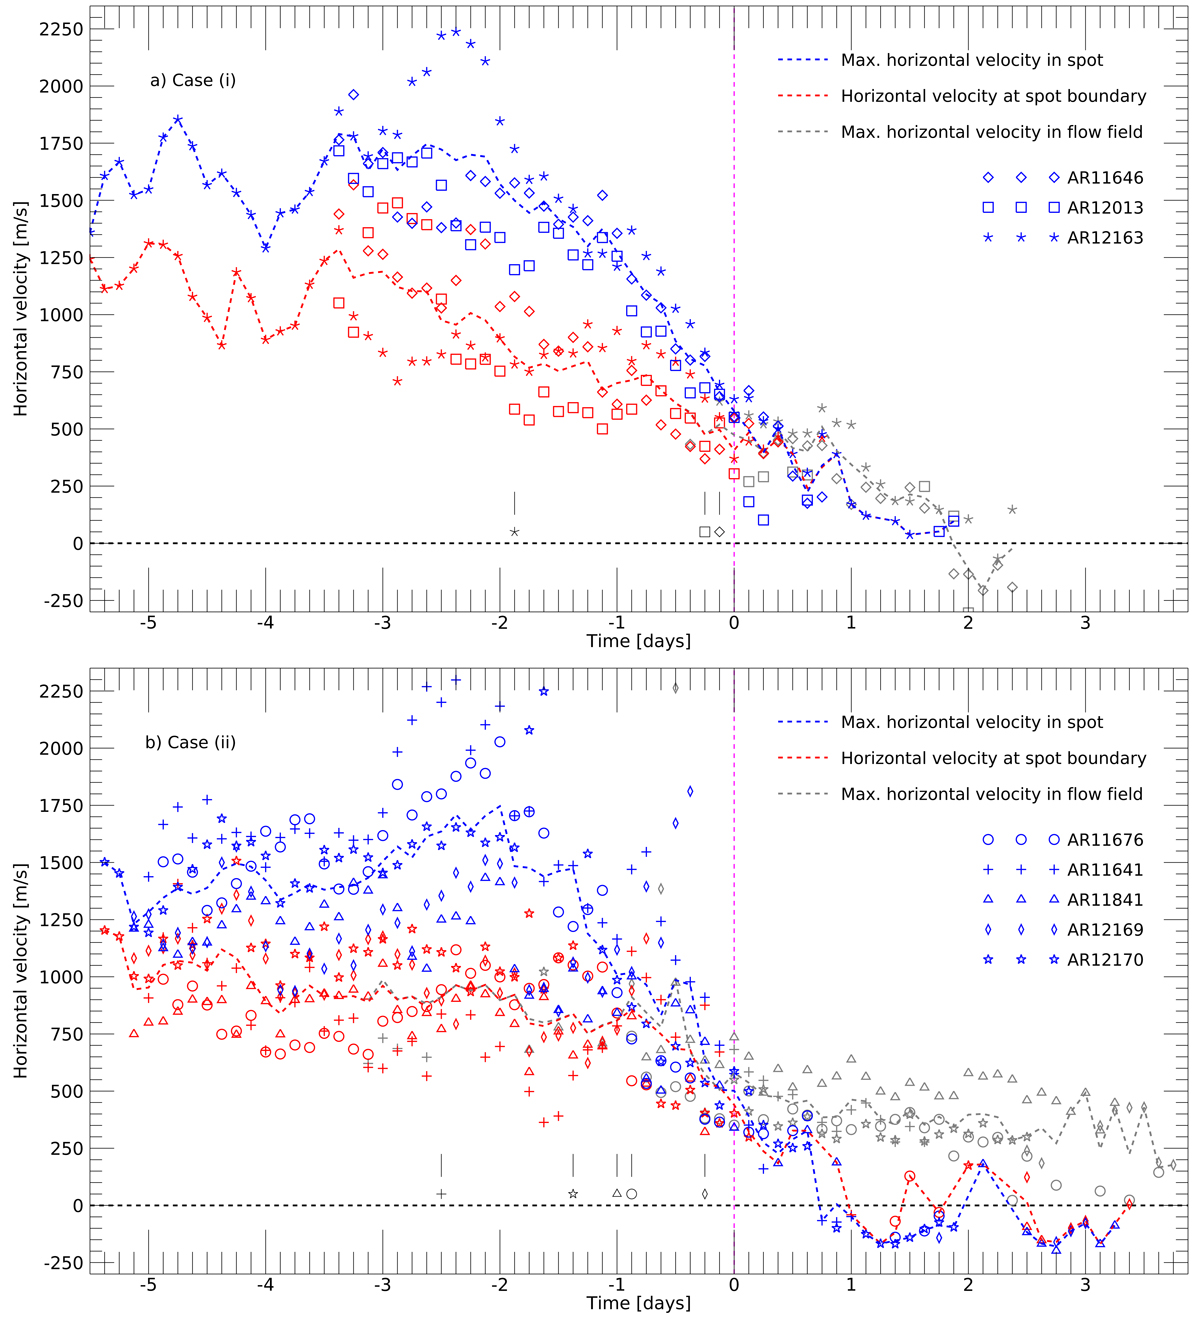
Fig. 4.
Download original image
Evolution of the maximum horizontal velocity of the flow within the spot boundary (blue), its surrounding region (grey), and the horizontal velocity at the spot boundary (red) for three selected active regions for Case (i) and five active regions for Case (ii). The loss of the penumbra was set as a common point in time, i.e., t = 0 h. Black symbols and short vertical lines indicate the crossing of the meridian of the respective AR within the evolution.
Current usage metrics show cumulative count of Article Views (full-text article views including HTML views, PDF and ePub downloads, according to the available data) and Abstracts Views on Vision4Press platform.
Data correspond to usage on the plateform after 2015. The current usage metrics is available 48-96 hours after online publication and is updated daily on week days.
Initial download of the metrics may take a while.