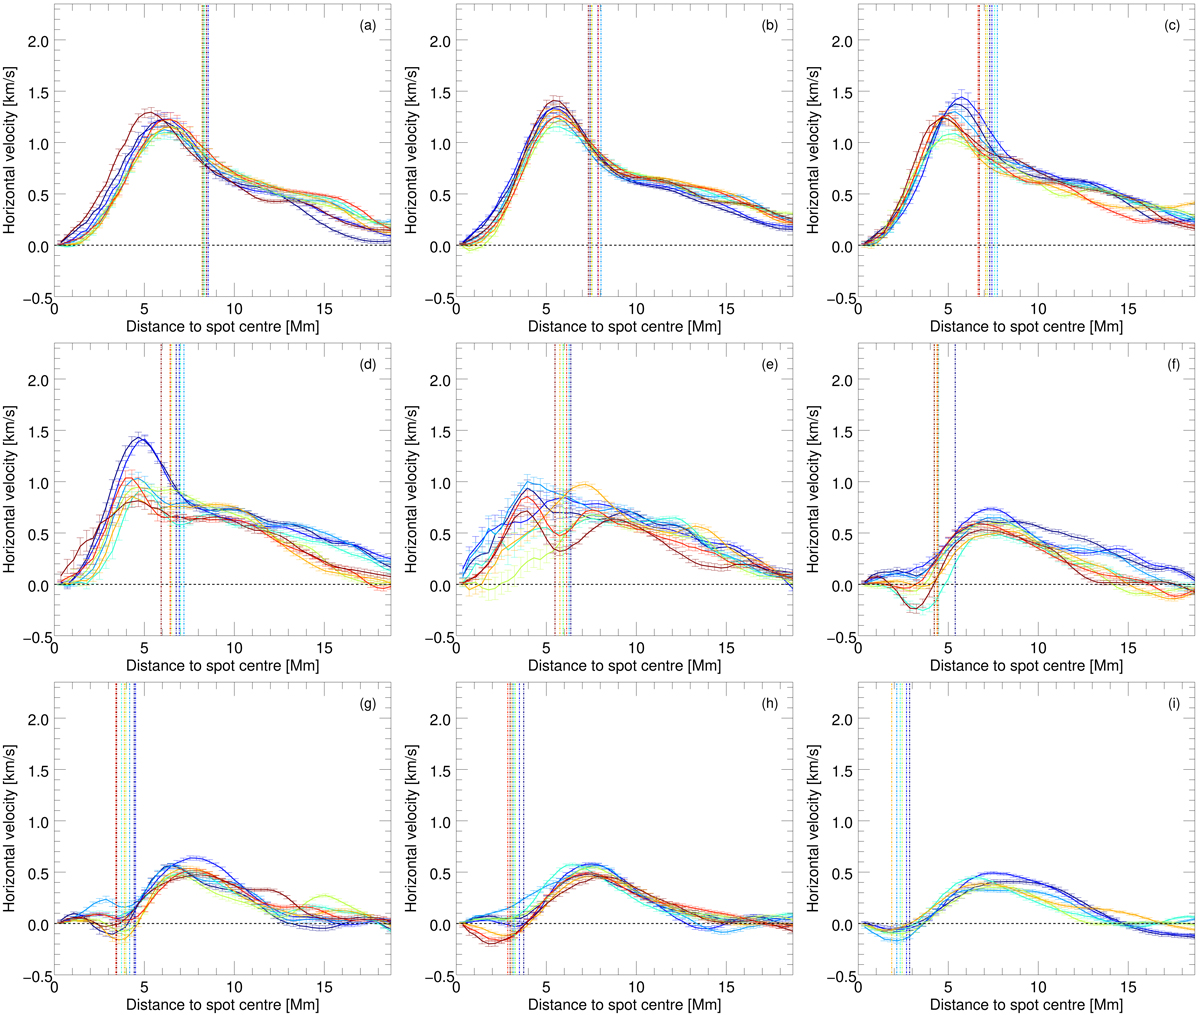
Fig. 3.
Download original image
Same as Fig. 2, but for nine successive days (panels a–i) of AR11841, representative for Case (ii) of the evolution of the flow field. The penumbra has dissolved on the fourth day of the analysis at time step 5 (green profile in panel d). Error bars represent the standard deviation. Vertical lines display the position of the spot boundary.
Current usage metrics show cumulative count of Article Views (full-text article views including HTML views, PDF and ePub downloads, according to the available data) and Abstracts Views on Vision4Press platform.
Data correspond to usage on the plateform after 2015. The current usage metrics is available 48-96 hours after online publication and is updated daily on week days.
Initial download of the metrics may take a while.