Fig. 1.
Download original image
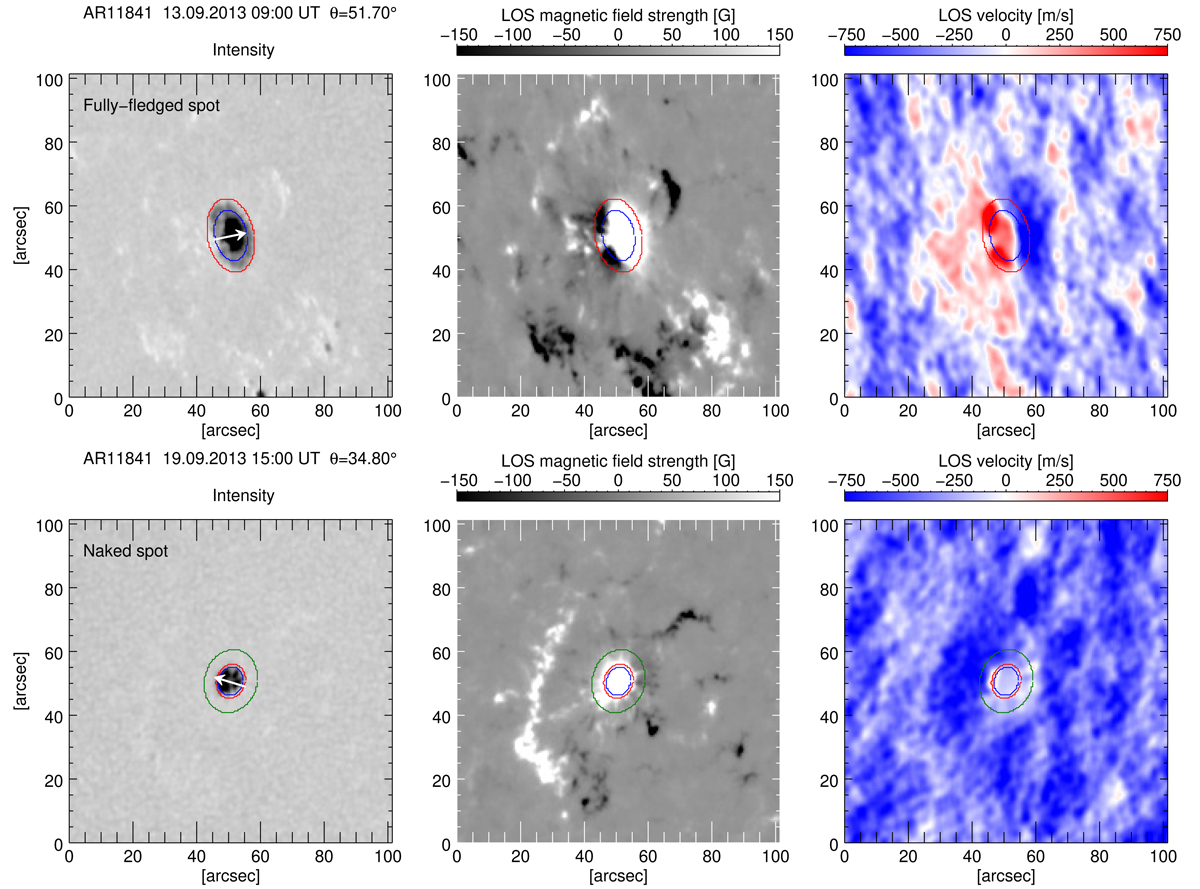
Intensity map (left), LOS magnetogram (middle), and Doppler map (right) show the sunspot of AR11841 on the first day (top) of the analysis and six days later (bottom). The position of the maximum horizontal velocity within the spot, within the surroundings, and the radius of the spot are marked by blue, green, and red ellipses, respectively. The arrow in the intensity map points in the direction of disc centre.
Current usage metrics show cumulative count of Article Views (full-text article views including HTML views, PDF and ePub downloads, according to the available data) and Abstracts Views on Vision4Press platform.
Data correspond to usage on the plateform after 2015. The current usage metrics is available 48-96 hours after online publication and is updated daily on week days.
Initial download of the metrics may take a while.