Free Access
Fig. 5
Download original image
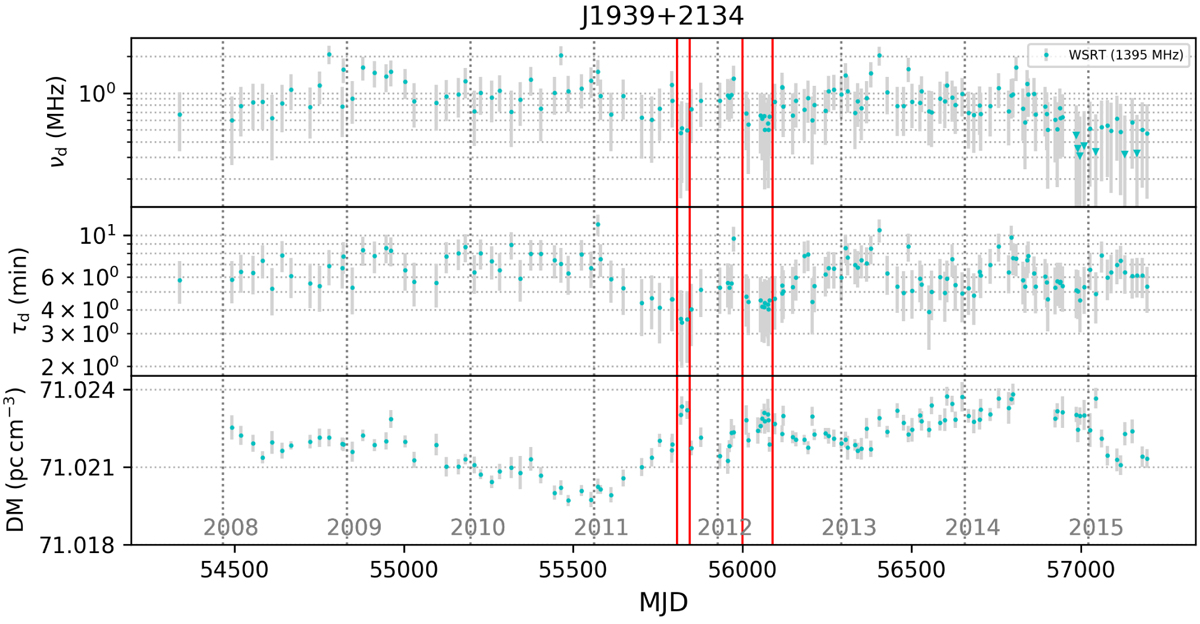
Time series of scintillation bandwidth vd, scintillation timescale τd and DM for PSR J1939+2134. There are two events, that show decreases in vd and τd, and increases in DM, which are indicated by the red lines. The first one is between MJDs 55807 and 55845, the second one is between MJDs 56000 and 56090.
Current usage metrics show cumulative count of Article Views (full-text article views including HTML views, PDF and ePub downloads, according to the available data) and Abstracts Views on Vision4Press platform.
Data correspond to usage on the plateform after 2015. The current usage metrics is available 48-96 hours after online publication and is updated daily on week days.
Initial download of the metrics may take a while.