Fig. 3
Download original image
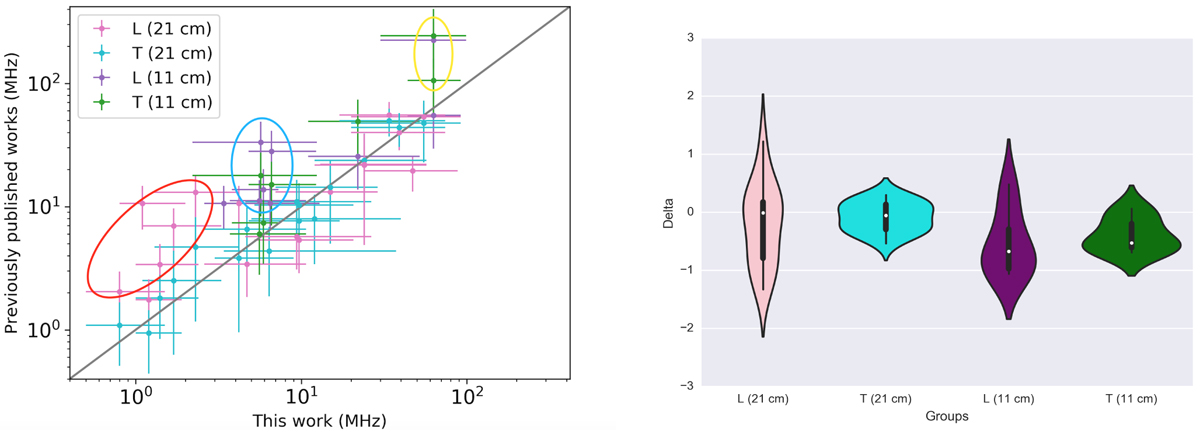
The left panel compares the vd from previous works to our measurements. Here, “L” indicates Levin et al. (2016), “T” refers to Turner et al. (2021), “11 cm” compares against measurements we made in the 2-GHz range; “21 cm” refers to measurements we made in the 1-GHz range – in both cases the previously published measurements were rescaled to our observing frequency, as given in Col. (3) of Table 2. Data from Levin et al. (2016) were at 1500 MHz while Turner et al. (2021) used data at 1500 MHz as well as 820 MHz, but we only compare to the former. The three ellipses indicate groups of points that show significant offsets, which are discussed in more detail in the text. The right-hand panel shows violin plot for the distribution of the differences (Delta) of the four groups between the vd of our measurements and the vd from previous studies.
Current usage metrics show cumulative count of Article Views (full-text article views including HTML views, PDF and ePub downloads, according to the available data) and Abstracts Views on Vision4Press platform.
Data correspond to usage on the plateform after 2015. The current usage metrics is available 48-96 hours after online publication and is updated daily on week days.
Initial download of the metrics may take a while.