Fig. 1
Download original image
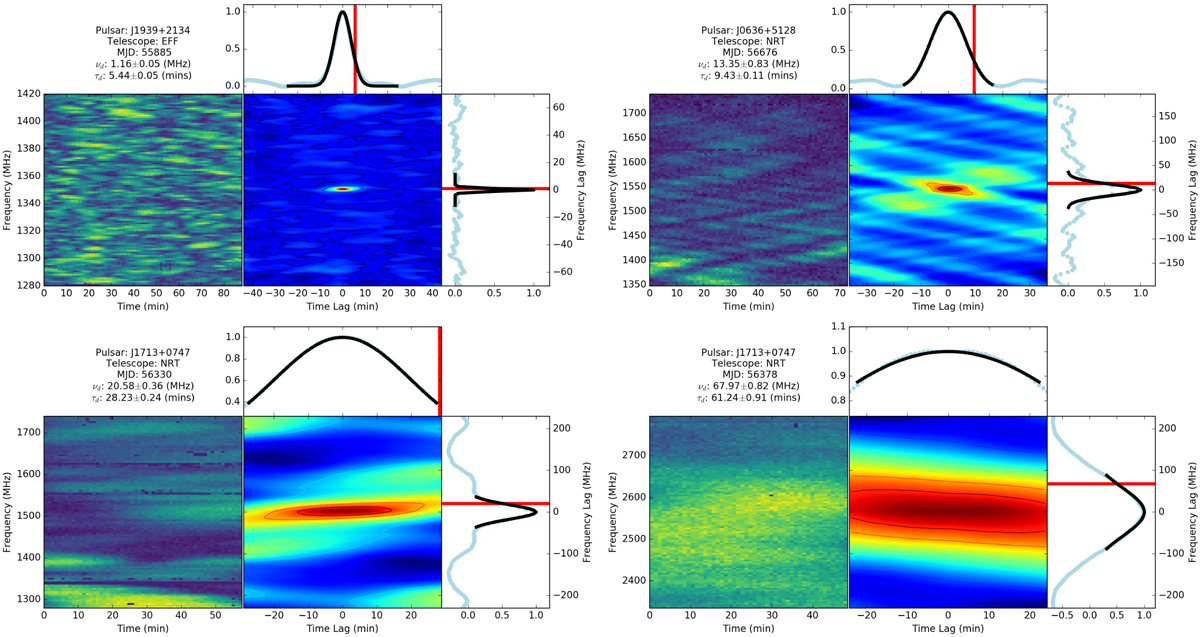
Dynamic spectra I(f, t) from four observations with different scintle sizes in the left panels and their normalized autocorrelation functions in the right panels. The horizontal and vertical axes correspond to the time (or time lag) and frequency (or frequency lag), respectively. In the two smaller side plots, the sky blue points are the 1D autocorrelation functions at zero time and frequency lag, the black lines are the best Gaussian fits, the red lines indicate the values for vd and τd. The pulsar name, telescope, epoch of observation, vd and τd are given above the dynamic spectra.
Current usage metrics show cumulative count of Article Views (full-text article views including HTML views, PDF and ePub downloads, according to the available data) and Abstracts Views on Vision4Press platform.
Data correspond to usage on the plateform after 2015. The current usage metrics is available 48-96 hours after online publication and is updated daily on week days.
Initial download of the metrics may take a while.