Fig. 7
Download original image
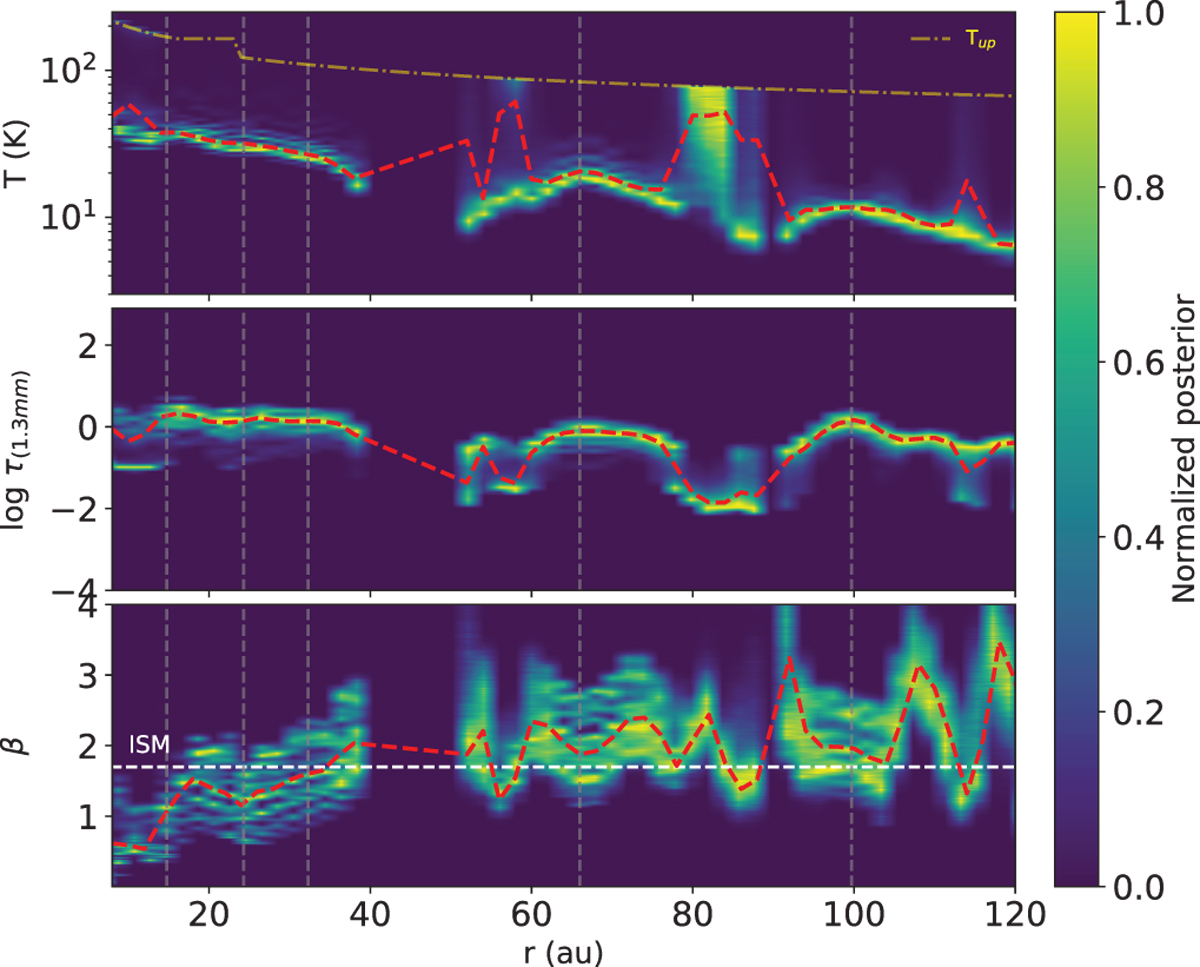
Best fit parameters for the power law model: temperature, optical depth, and opacity spectral index β as function of the radius. The dashed red curve represents the estimates obtained as the mean values of the posterior distributions from the Monte Carlo nested sampling fit. The color map is the normalized probability after merging the 30 posteriors obtained introducing a random offset in the fluxes according to their flux calibration accuracy. The dashed-dotted curve in the upper panel shows the upper limit of the Temperature prior for each radius used in the fit (see Appendix D). The vertical dashed lines correspond to the dust ring found in Sect. 3.2, while the white dashed line in the bottom panel is drawn for β = 1.7, corresponding to ISM dust grains.
Current usage metrics show cumulative count of Article Views (full-text article views including HTML views, PDF and ePub downloads, according to the available data) and Abstracts Views on Vision4Press platform.
Data correspond to usage on the plateform after 2015. The current usage metrics is available 48-96 hours after online publication and is updated daily on week days.
Initial download of the metrics may take a while.