Fig. 6
Download original image
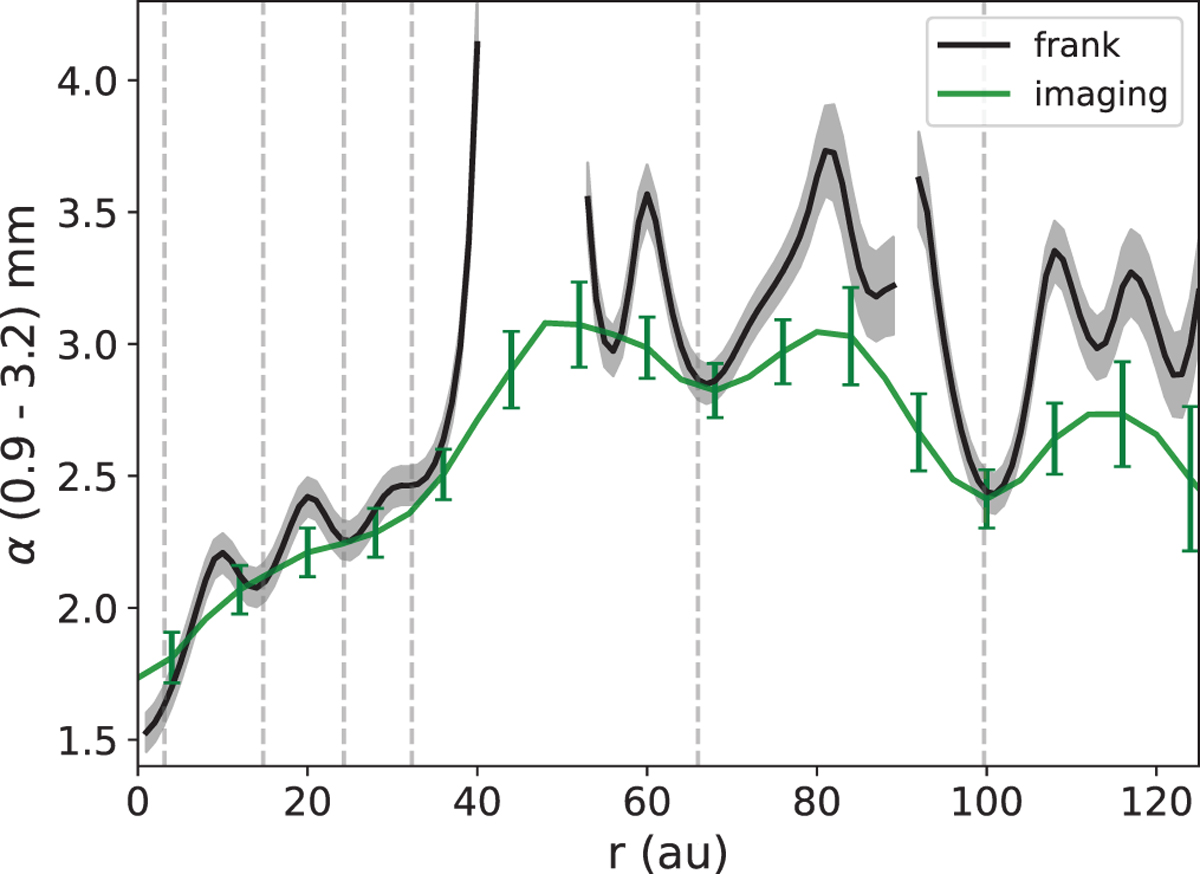
Flux spectral index between 0.9 mm and 3.2mm computed from the radial profiles extracted with frank (Sect. 3.2, black curve), with shaded areas representing the errors derived from the linear least-squares regression (with the uncertainties for the single fluxes defined as the sum in quadrature of the statistical and calibration errors). The profile is masked at the locations where the flux S/N < 3 for at least one wavelength. Overplotted is the azimuthal average of the map in Fig. 5 (green curve), calculated with bins of 1 beam (~0.″08) and with errorbars computed as for the profiles in Fig. 5, right panel.
Current usage metrics show cumulative count of Article Views (full-text article views including HTML views, PDF and ePub downloads, according to the available data) and Abstracts Views on Vision4Press platform.
Data correspond to usage on the plateform after 2015. The current usage metrics is available 48-96 hours after online publication and is updated daily on week days.
Initial download of the metrics may take a while.