Fig. 5
Download original image
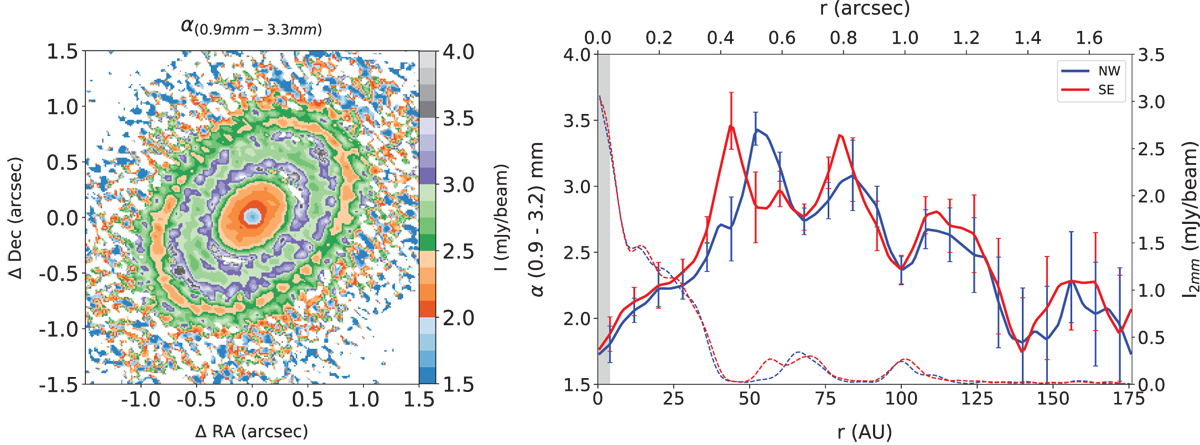
Flux density spectral index. Left: map of the spectral index computed from the ALMA continuum images at 0.9 mm, 1.3 mm, 2.1 mm, 2.8 mm and 3.2mm with a matching beam of 0.″095 × 0.″065 and position angle of 61.24°. Right: radial profile of the spectral index in the northwest and southeast sides (blue and red curve, respectively), error bars are shown for each bin and calculated as described in the text. Overplotted with dashed lines is the corresponding flux density profiles in Band 4 (right y axis). The grey shaded region on the left denotes the angular resolution of the map as half of the average beam FWHM.
Current usage metrics show cumulative count of Article Views (full-text article views including HTML views, PDF and ePub downloads, according to the available data) and Abstracts Views on Vision4Press platform.
Data correspond to usage on the plateform after 2015. The current usage metrics is available 48-96 hours after online publication and is updated daily on week days.
Initial download of the metrics may take a while.