Fig. 3
Download original image
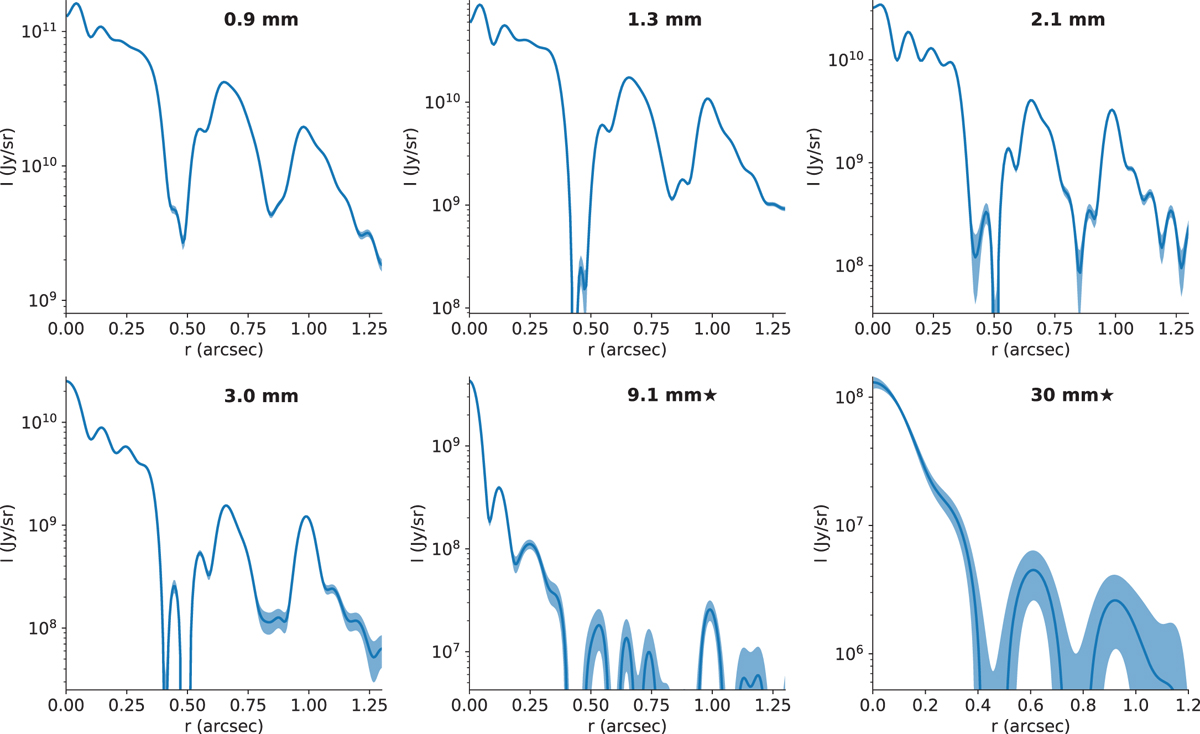
Radial profiles of the continuum emission derived with frank for each dataset, the shaded regions represent the statistical error computed by the frank fit. The star symbol in the plots relative to the VLA datasets indicates that these have been first corrected for the free-free/centrally peaked contamination, as described in Appendix C.
Current usage metrics show cumulative count of Article Views (full-text article views including HTML views, PDF and ePub downloads, according to the available data) and Abstracts Views on Vision4Press platform.
Data correspond to usage on the plateform after 2015. The current usage metrics is available 48-96 hours after online publication and is updated daily on week days.
Initial download of the metrics may take a while.