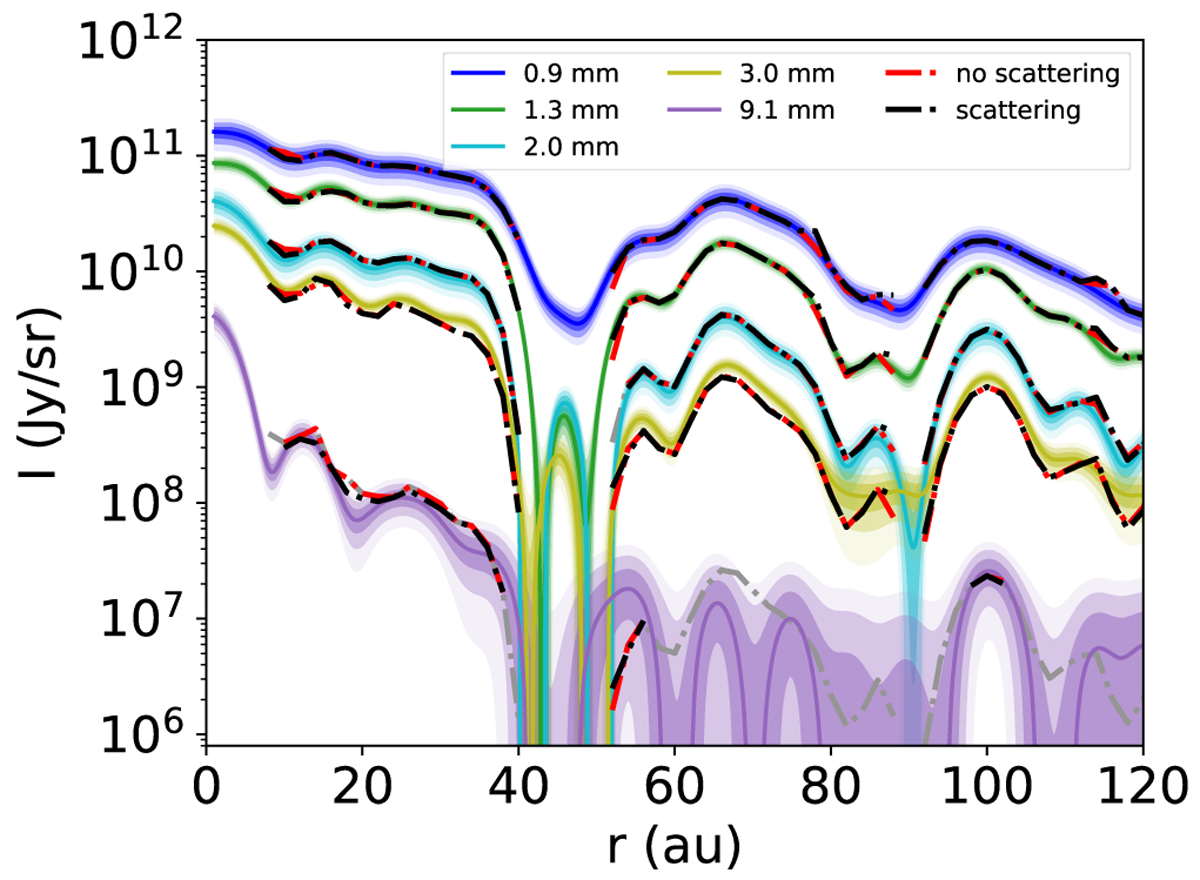
Fig. D.4
Download original image
Flux densities at the five different wavelengths predicted by the best-fit physical models using standard grains in the nonscattering and scattering case. The red and black dashed-dotted curve shows the models predictions at the radii where the flux at each wavelength was included in the fitting procedure (only fluxes larger than 3 times the rms error were considered at each radius). The grey curve shows the scattering model prediction at all radii.
Current usage metrics show cumulative count of Article Views (full-text article views including HTML views, PDF and ePub downloads, according to the available data) and Abstracts Views on Vision4Press platform.
Data correspond to usage on the plateform after 2015. The current usage metrics is available 48-96 hours after online publication and is updated daily on week days.
Initial download of the metrics may take a while.