Fig. 2
Download original image
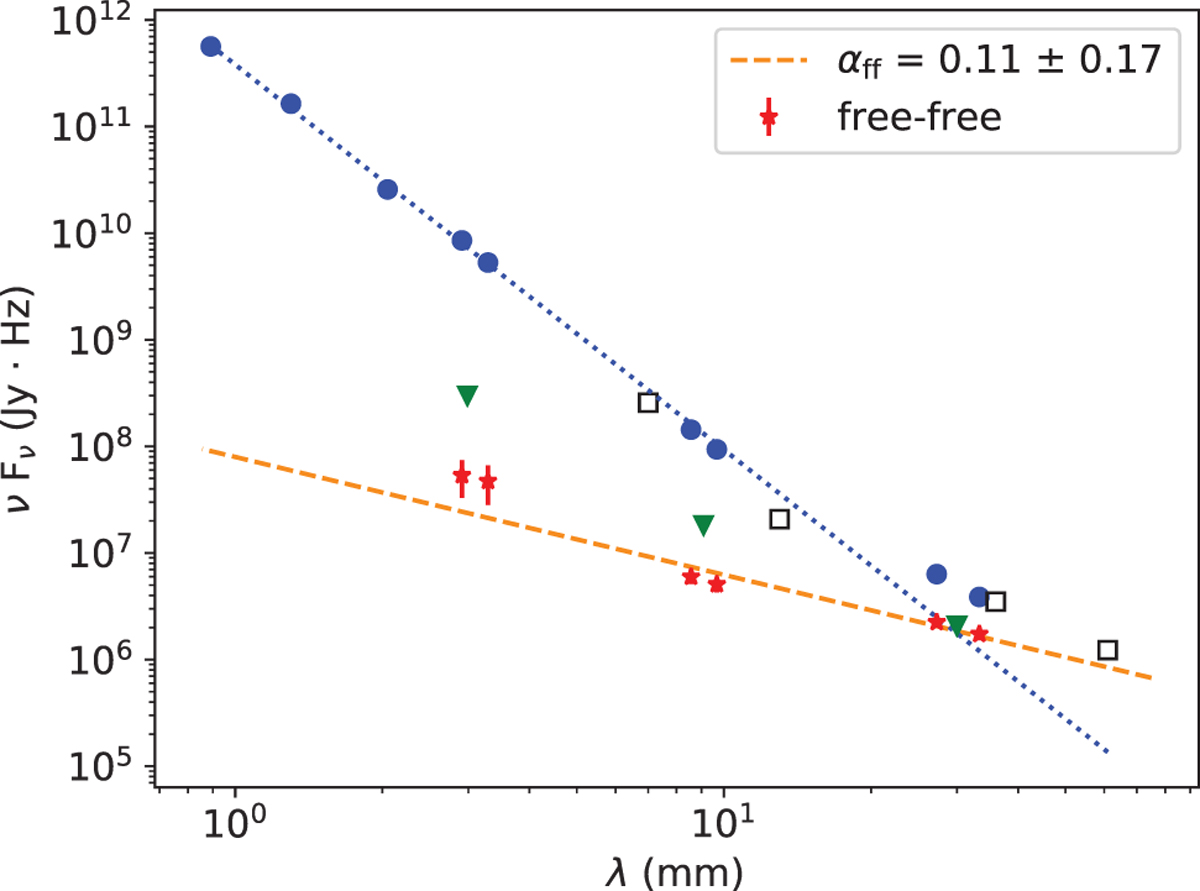
Spectral energy distribution of HD 163296. The blue circles represent the integrated fluxes from the data analyzed in this work, while empty squares are values from the literature (Isella et al. 2007; Natta et al. 2004; Guidi et al. 2016). The blue dotted curve corresponds to a curve with spectral index of 2.6. Red stars are the contamination from a central compact emission, determined by the asymptotic values of the visibilities as described in Sect. 3.1, and that are best fitted by a power law with index 0.11. Green triangles are upper limits for the free-free emission (see Sect. 3.1), and correspond to the emission within a radius of 5 au.
Current usage metrics show cumulative count of Article Views (full-text article views including HTML views, PDF and ePub downloads, according to the available data) and Abstracts Views on Vision4Press platform.
Data correspond to usage on the plateform after 2015. The current usage metrics is available 48-96 hours after online publication and is updated daily on week days.
Initial download of the metrics may take a while.