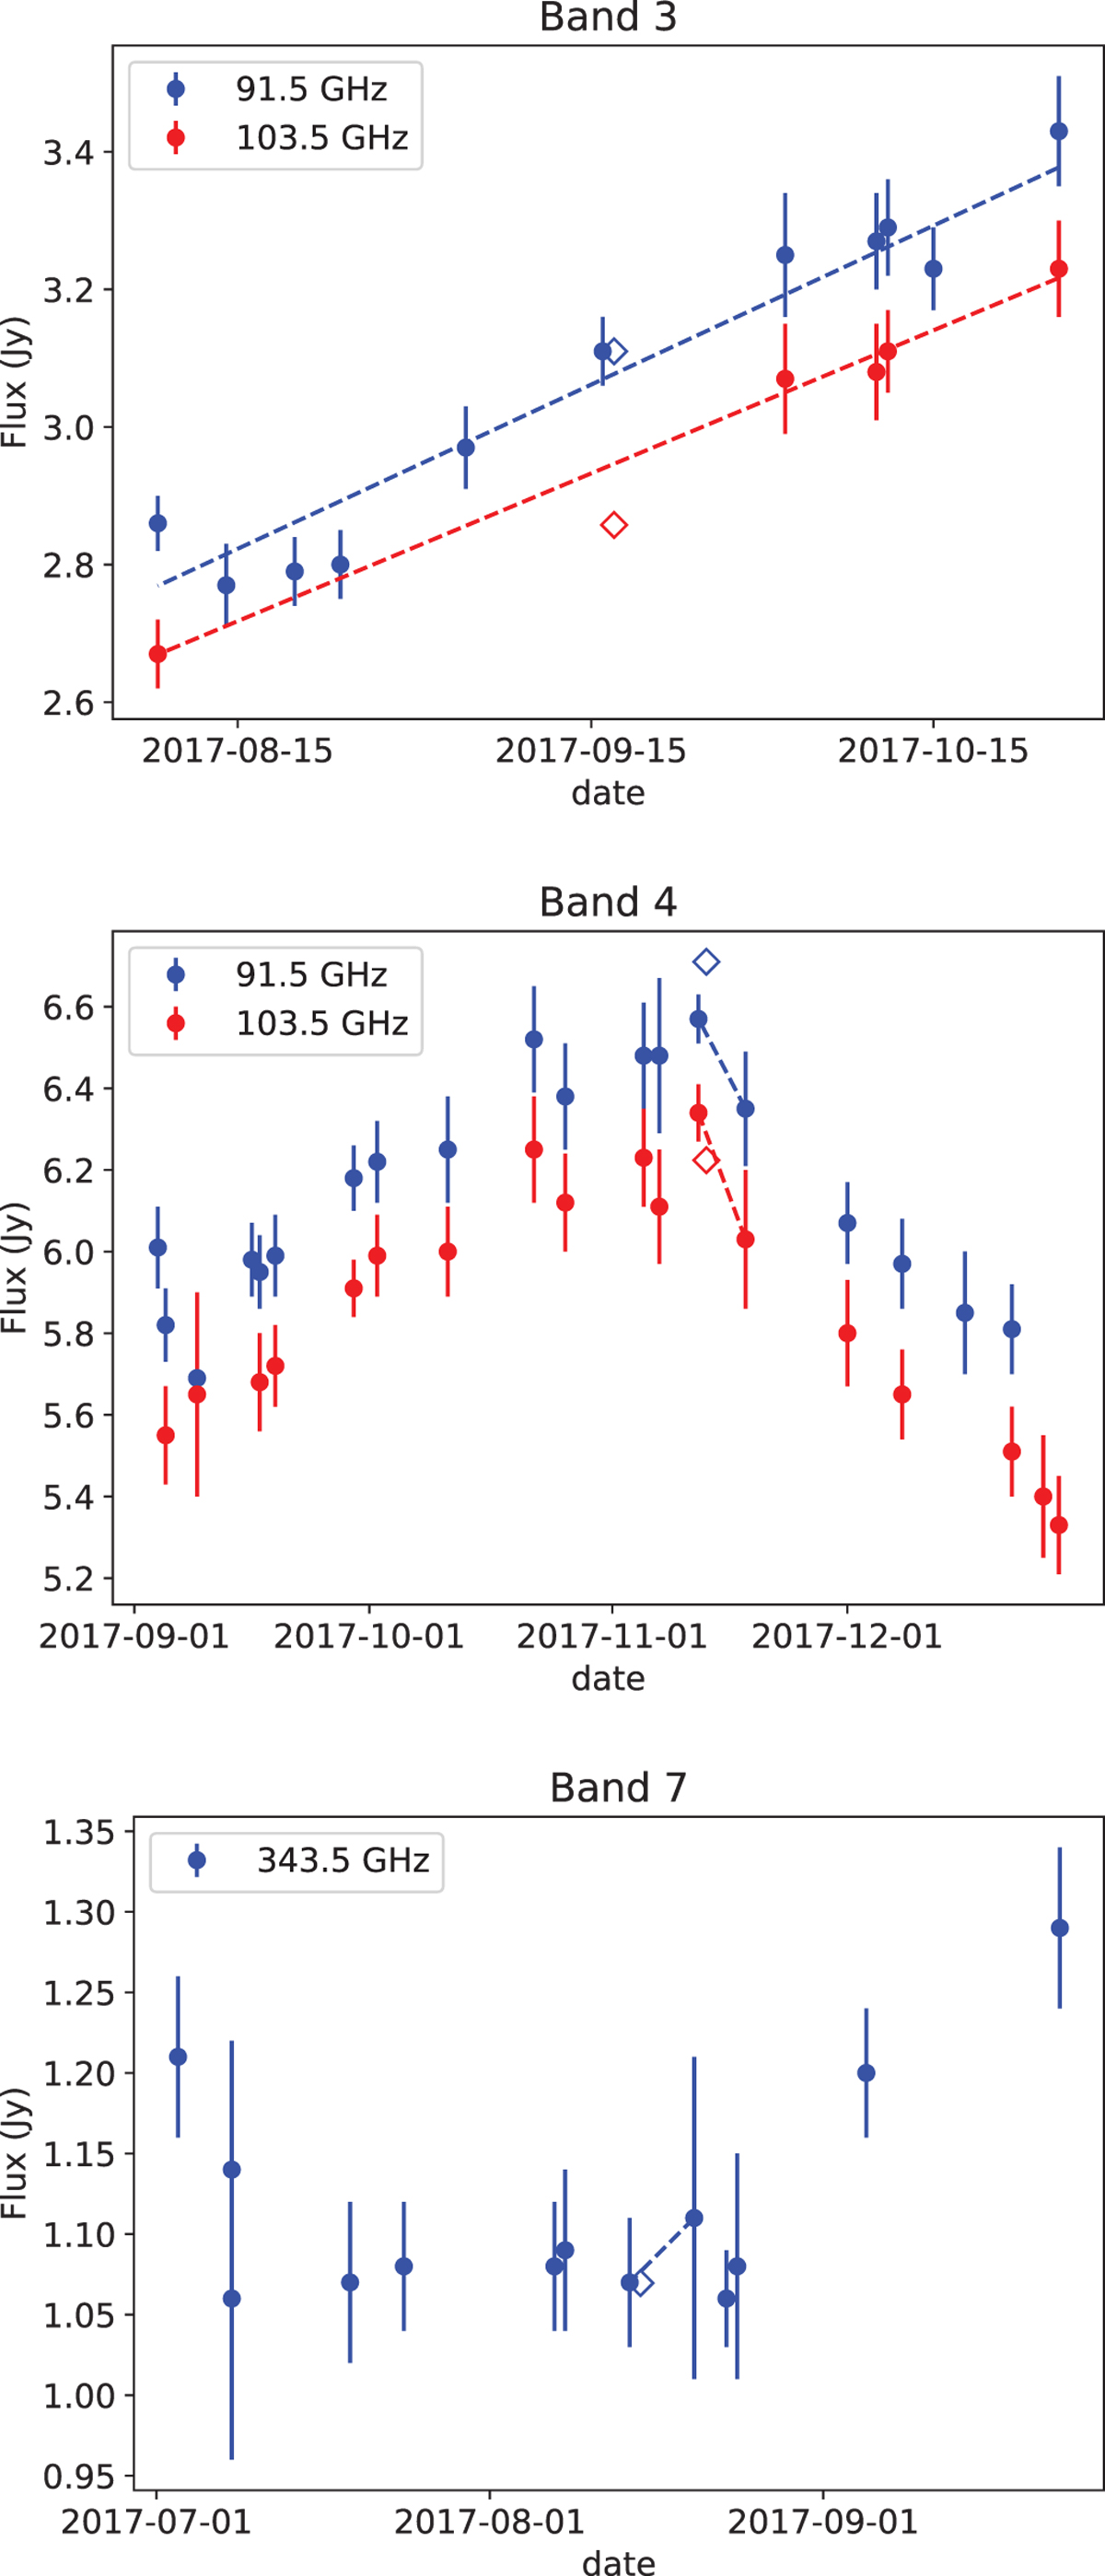
Fig. A.1
Download original image
Calibrators measurements. Upper panel: ALMA measurements of the J1733-1304 calibrator are plotted as blue and red circles, with corresponding error bars, at the two frequencies of Band 3, respectively. The diamond markers represent the amplitudes set for the flux calibrator in the CASA calibration script. Dashed lines are the linear regression between the plotted catalogue measurements Middle panel: same as for the upper panel, but with the values of the flux calibrator for Band 4 (J 1924-2914), scaled at the frequencies of Band 3 with the spectral index used during calibration. Lower panel: measurements of the J1733-1304 calibrator used for the observations at Band 7. The time range on the x-axis is three months in all the panels.
Current usage metrics show cumulative count of Article Views (full-text article views including HTML views, PDF and ePub downloads, according to the available data) and Abstracts Views on Vision4Press platform.
Data correspond to usage on the plateform after 2015. The current usage metrics is available 48-96 hours after online publication and is updated daily on week days.
Initial download of the metrics may take a while.