Open Access
Fig. 15
Download original image
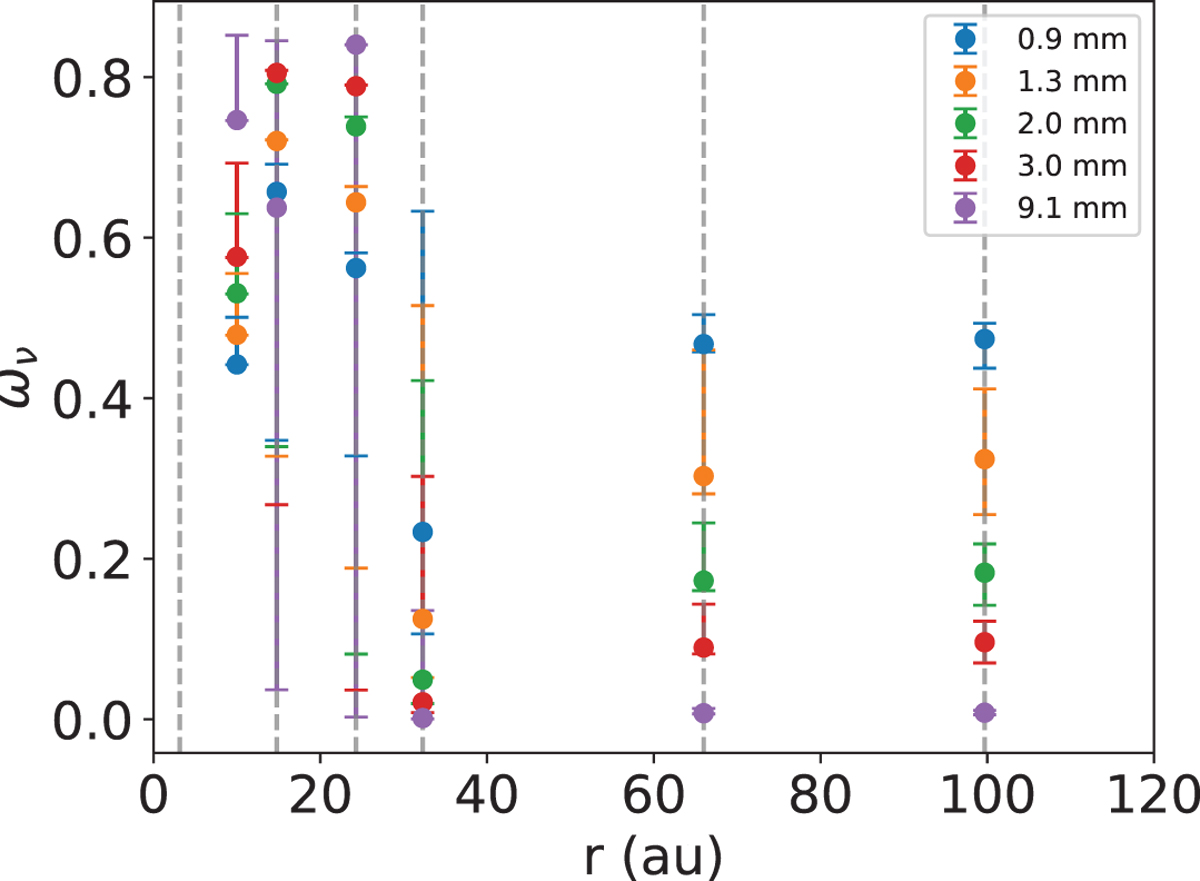
Albedo at the different wavelengths from our best-fit physical model, shown at specific locations in the disk. The error bars correspond to the 16th and 84th percentile of the set models, the vertical dashed line are drawn at the position of the flux peaks at 2 mm.
Current usage metrics show cumulative count of Article Views (full-text article views including HTML views, PDF and ePub downloads, according to the available data) and Abstracts Views on Vision4Press platform.
Data correspond to usage on the plateform after 2015. The current usage metrics is available 48-96 hours after online publication and is updated daily on week days.
Initial download of the metrics may take a while.