Open Access
Fig. 14
Download original image
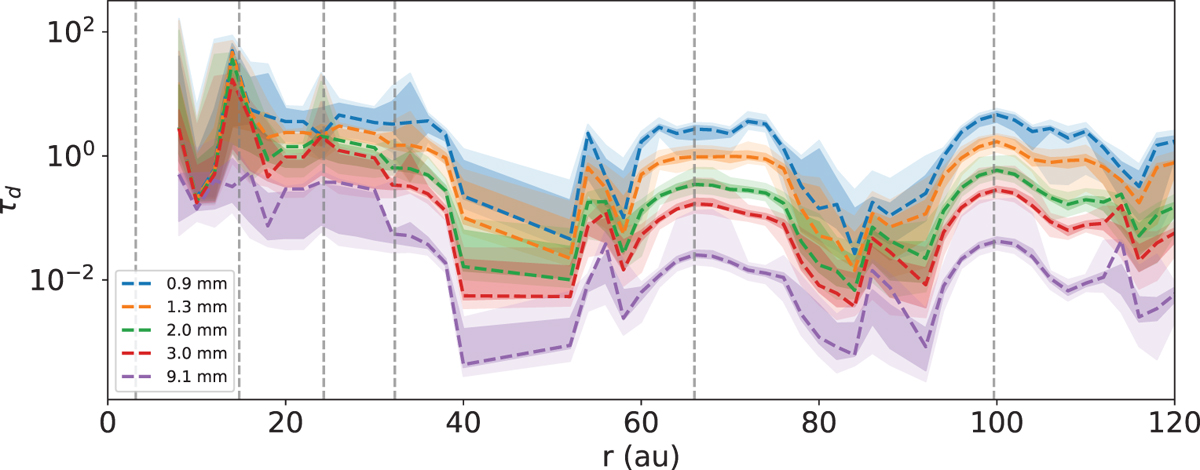
Optical depth at the five different wavelength, resulting from the best fit model shown as a dashed curve in Fig. 13. The uncertainties (shaded regions) correspond to 1 and 2σ (16th/84th and 2.5th/97.5th percentiles, respectively) of the distribution at each radius (see main text).
Current usage metrics show cumulative count of Article Views (full-text article views including HTML views, PDF and ePub downloads, according to the available data) and Abstracts Views on Vision4Press platform.
Data correspond to usage on the plateform after 2015. The current usage metrics is available 48-96 hours after online publication and is updated daily on week days.
Initial download of the metrics may take a while.