Fig. 12
Download original image
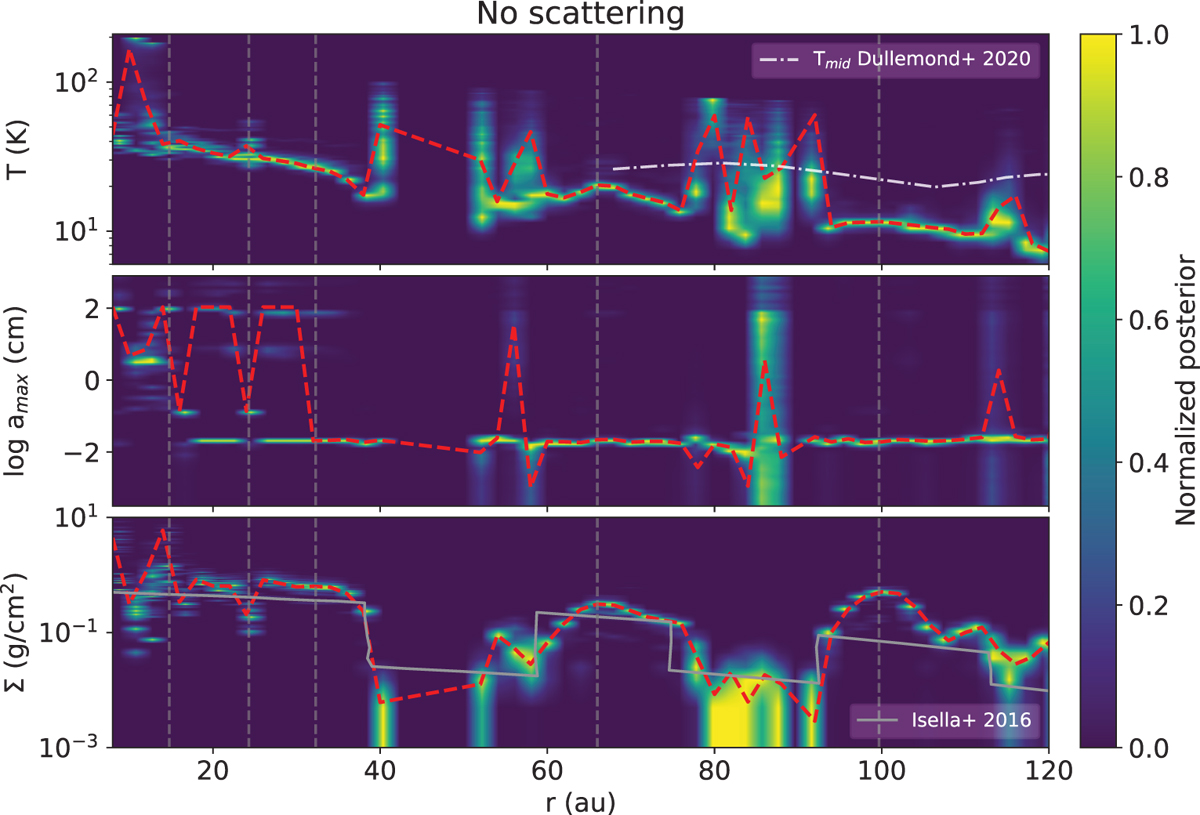
Temperature, maximum grain size and surface density as a function of the radius from the SED fitting with a model without scattering. The dashed red curve represents the estimates from the Monte Carlo fit including the statistical error only. The color map shows the normalized posterior distribution obtained merging 30 additional fits after introducing a random offset in the fluxes according to their flux calibration accuracy. The resonance in the opacity as function of amax (see Fig. 4) can result in a degeneracy of this parameter, e.g. in the inner disk inside ~40 au. In the top and bottom panels we overplot the temperature and surface density from previous studies.
Current usage metrics show cumulative count of Article Views (full-text article views including HTML views, PDF and ePub downloads, according to the available data) and Abstracts Views on Vision4Press platform.
Data correspond to usage on the plateform after 2015. The current usage metrics is available 48-96 hours after online publication and is updated daily on week days.
Initial download of the metrics may take a while.