Fig. 10
Download original image
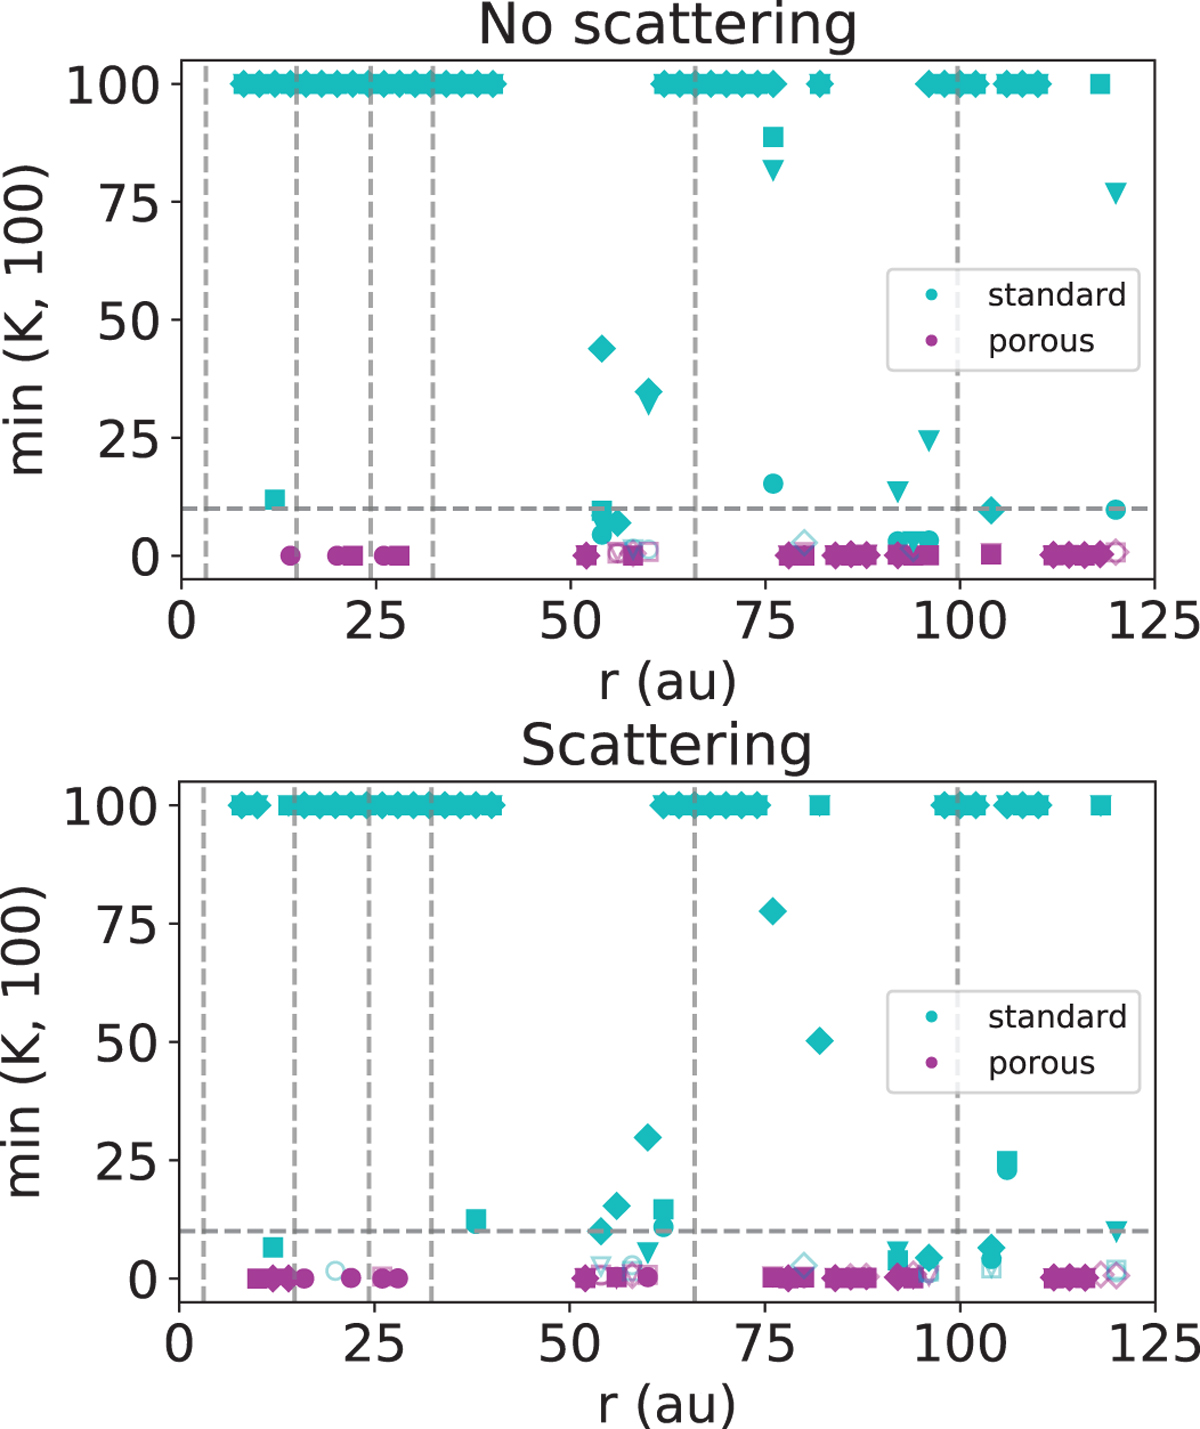
Bayes factor K calculated between the standard and the porous models as Zstandard/Zporous, for the nonscattering model (upper panel) and scattering model (lower panel). The different markers correspond to the different size distribution coefficients q. The points are color-coded according to their values: K > 1 (larger evidence for the standard composition) are drawn in cyan and K < 1 (larger evidence for porous composition) in magenta. Empty markers correspond to 1 < K < 3 or 1/3 < K < 1, full markers to K > 3 or K < 1/3. The horizontal dashed line is drawn at K = 10, so that all points above this line correspond to a strong evidence in favor of standard grains. The points larger than 100 are drawn at the location of 100, since for K ≥ 100 the interpretation in terms of evidence strength does not change (see Sect. 3.4).
Current usage metrics show cumulative count of Article Views (full-text article views including HTML views, PDF and ePub downloads, according to the available data) and Abstracts Views on Vision4Press platform.
Data correspond to usage on the plateform after 2015. The current usage metrics is available 48-96 hours after online publication and is updated daily on week days.
Initial download of the metrics may take a while.