Open Access
Fig. 2.
Download original image
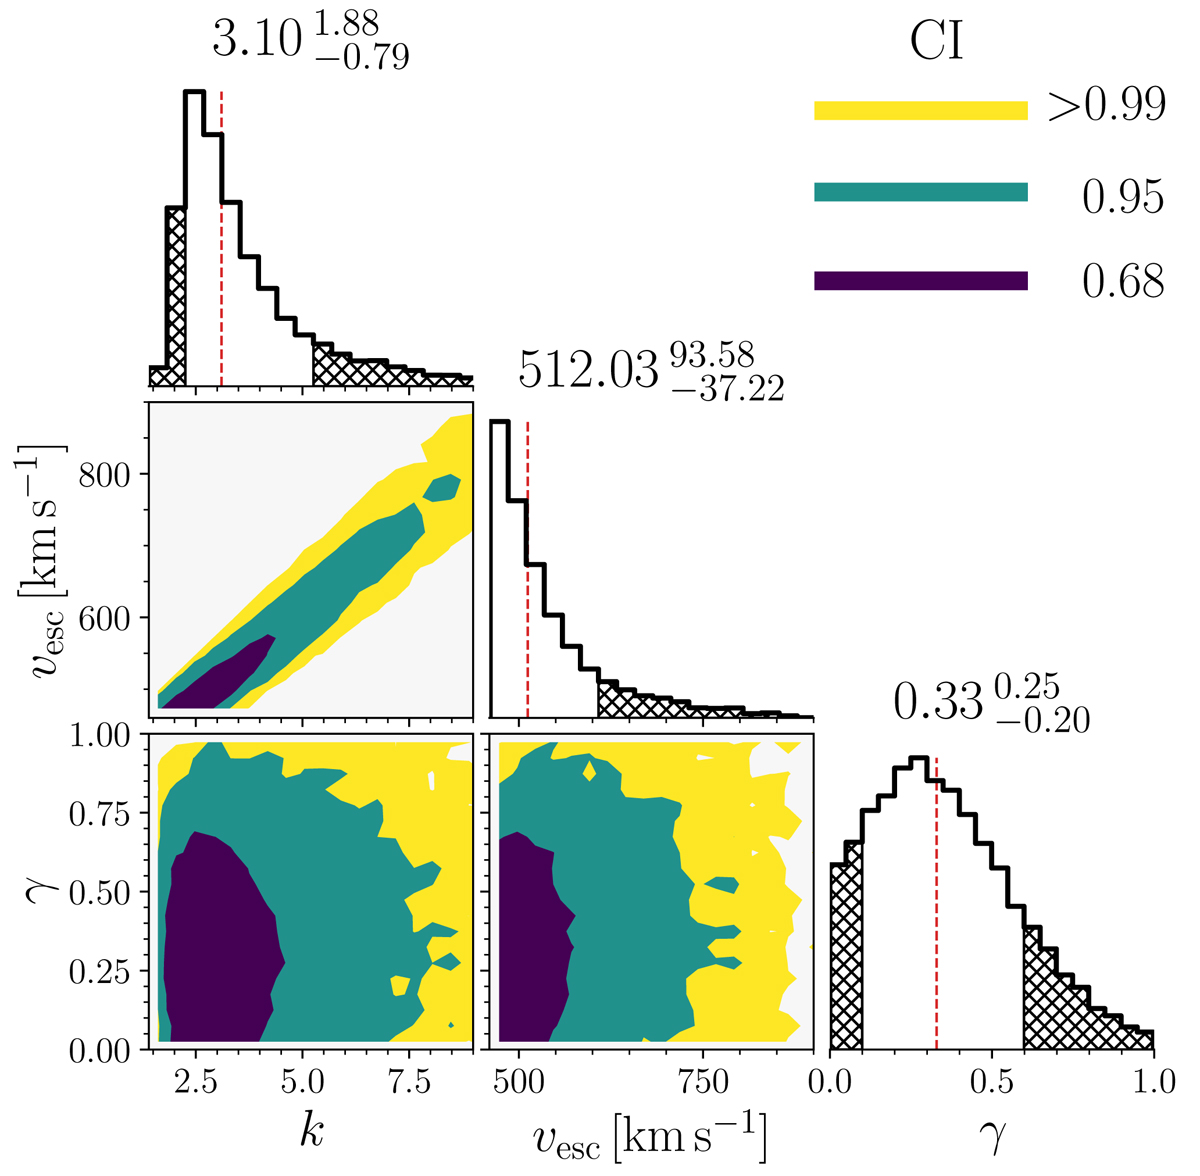
Corner plot for the fitted parameters k, vesc and γ, based on Eq. (19). Color contours denote the confidence intervals (CIs). The numbers above the histograms represent medians of distributions and their subscripts and superscripts stand for the 16th and 84th percentiles of the distribution.
Current usage metrics show cumulative count of Article Views (full-text article views including HTML views, PDF and ePub downloads, according to the available data) and Abstracts Views on Vision4Press platform.
Data correspond to usage on the plateform after 2015. The current usage metrics is available 48-96 hours after online publication and is updated daily on week days.
Initial download of the metrics may take a while.