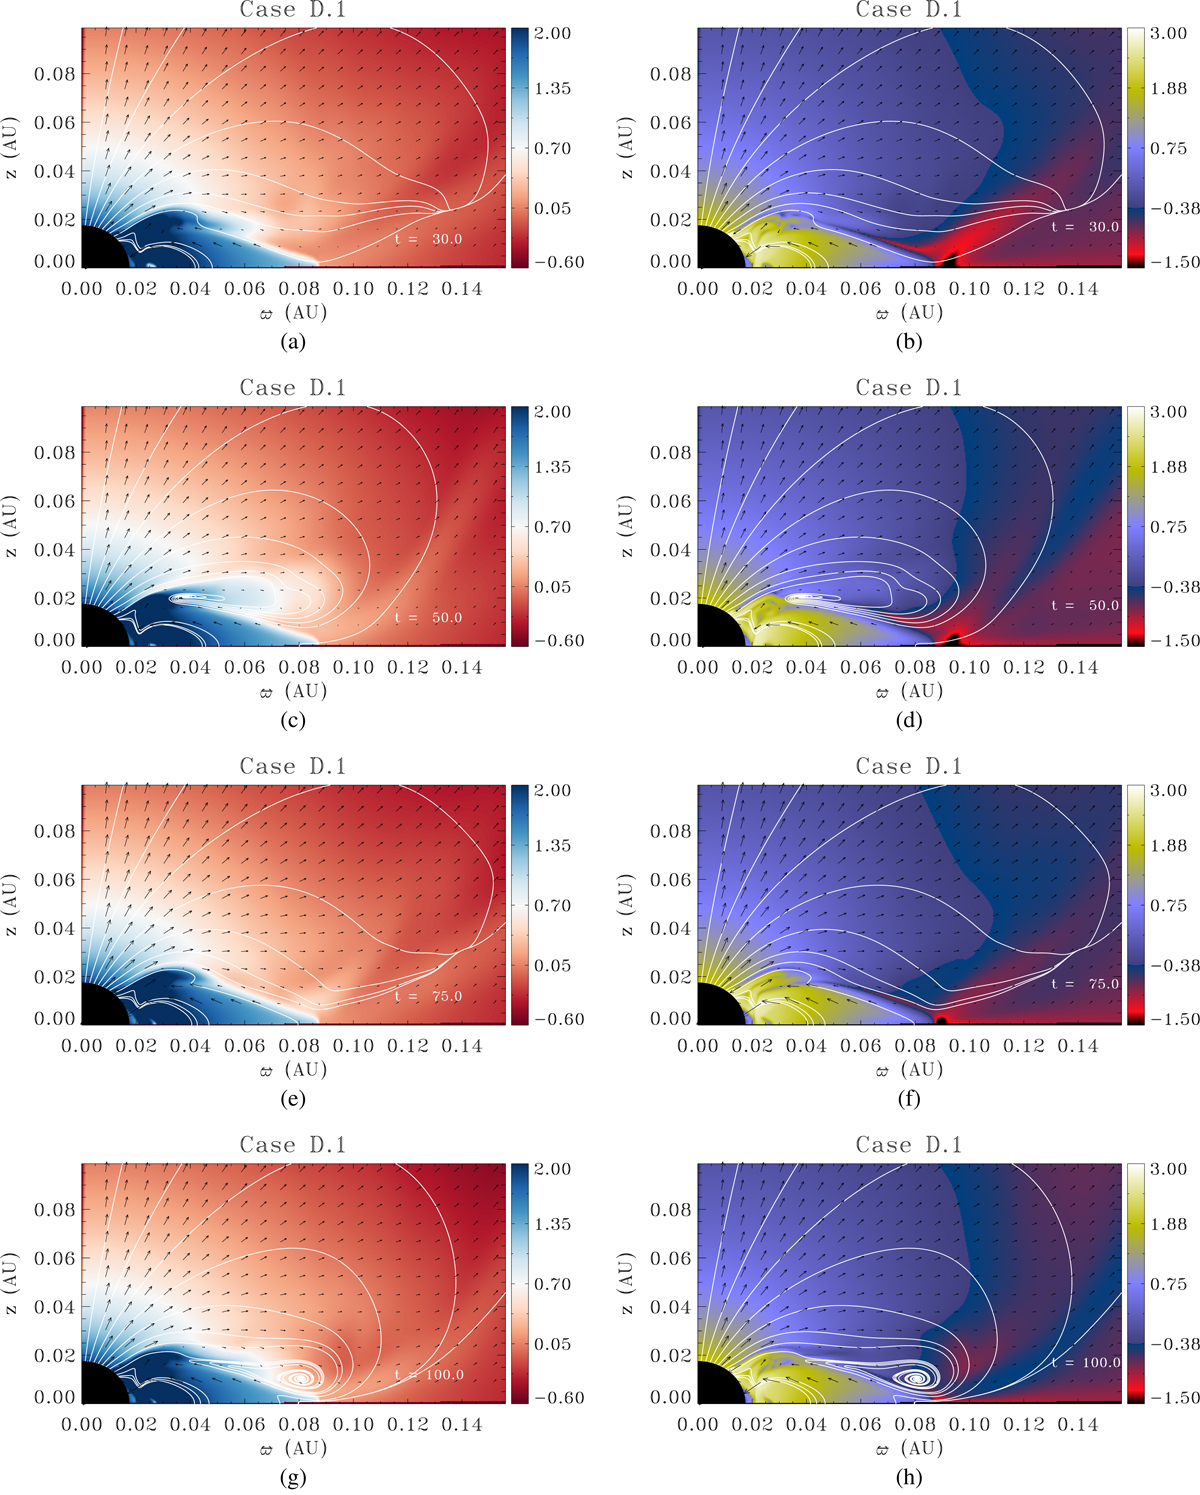
Fig. 4.
Download original image
Logarithmic density maps in PLUTO units (ρPLUTO = 2.48 × 10⁻¹⁵ g cm−3; left) and logarithmic mass flux maps, also in PLUTO units (ρVPLUTO = 2.75 × 10⁻⁸ g cm−2 s−1; right). We plot simulation case D.1 at PLUTO time = 30, 50, 75, and 100. The velocity vectors are shown as black arrows, and the magnetic field lines are represented by the solid white lines. The distances on the vertical (z) and horizontal (ϖ) axis are represented in astronomical units.
Current usage metrics show cumulative count of Article Views (full-text article views including HTML views, PDF and ePub downloads, according to the available data) and Abstracts Views on Vision4Press platform.
Data correspond to usage on the plateform after 2015. The current usage metrics is available 48-96 hours after online publication and is updated daily on week days.
Initial download of the metrics may take a while.