Fig. 16.
Download original image
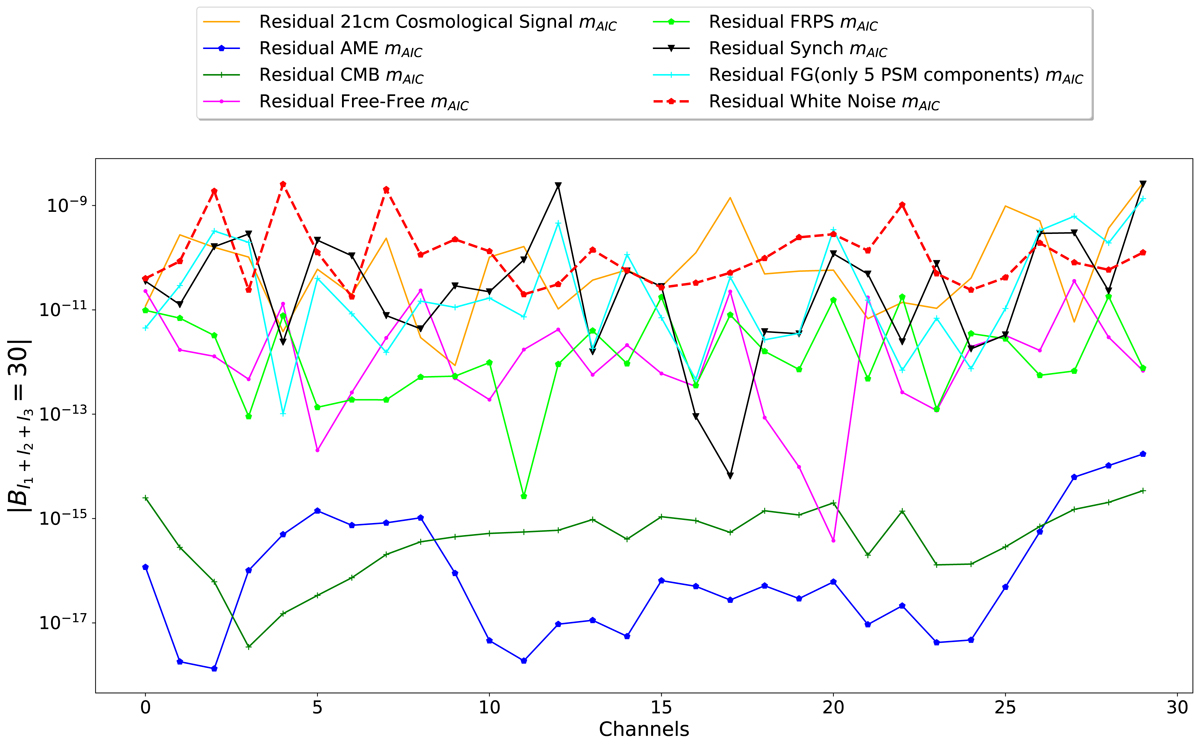
Bℓ1 + ℓ2 + ℓ3 = N for N = 30, for the GNILC reconstructed maps as a function of the channel number. The results are plotted for different projected components from our foregrounds as well as the noise and 21 cm input field, and show that the residuals can be compared to the original values expected within the 21 cm field and noise realization.
Current usage metrics show cumulative count of Article Views (full-text article views including HTML views, PDF and ePub downloads, according to the available data) and Abstracts Views on Vision4Press platform.
Data correspond to usage on the plateform after 2015. The current usage metrics is available 48-96 hours after online publication and is updated daily on week days.
Initial download of the metrics may take a while.