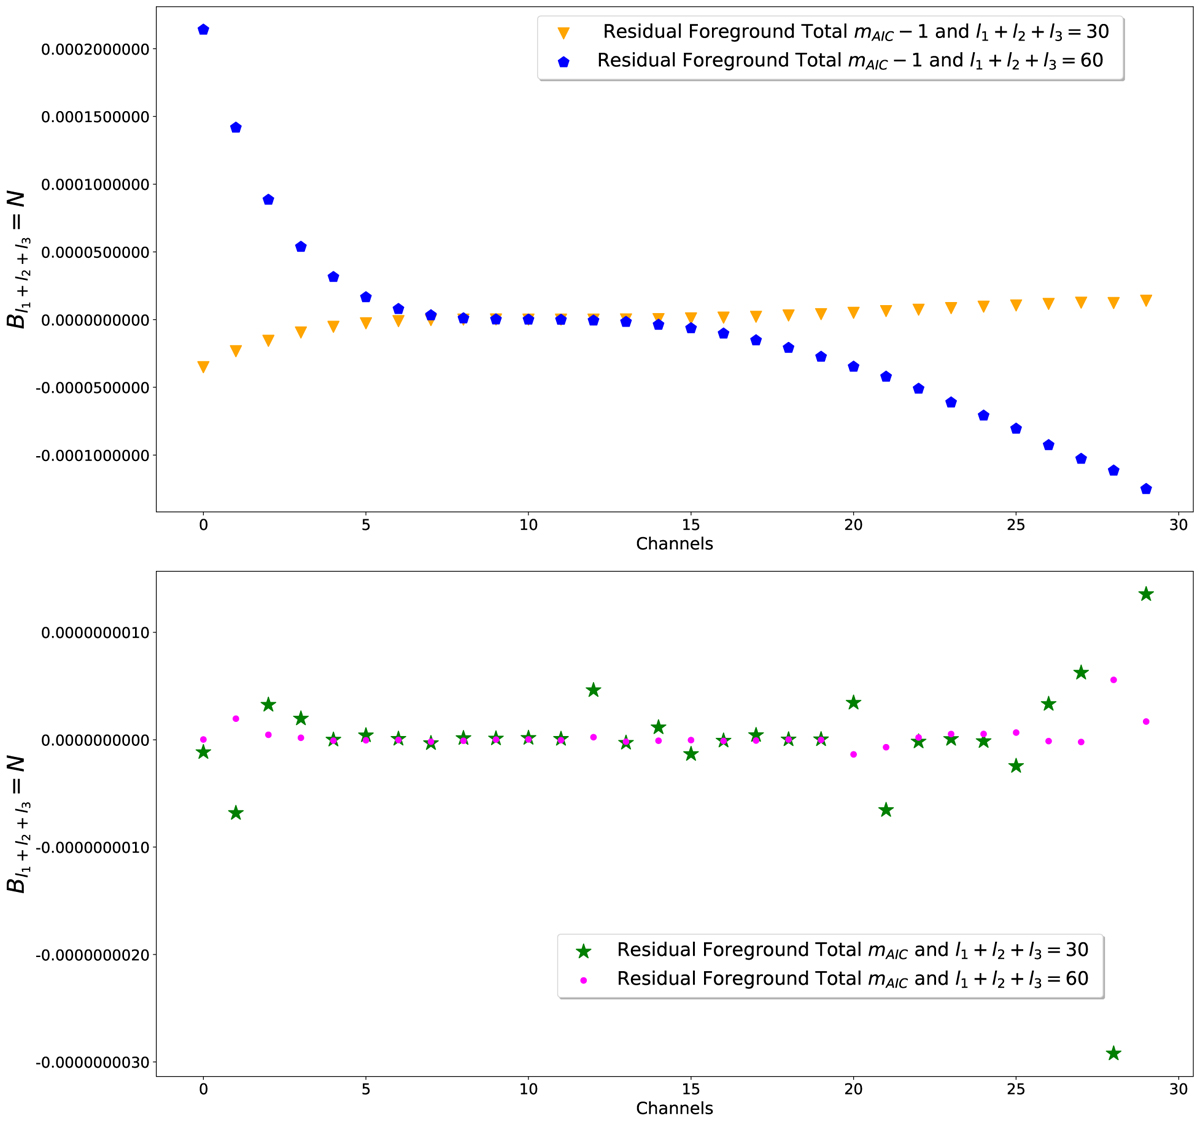
Fig. 15.
Download original image
Residual values for Bℓ1 + ℓ2 + ℓ3 = N for N = 30 and N = 60, for the GNILC reconstructed maps as a function of the channel number. We plot different values of mAIC (top and bottom figures), and the residuals are a few orders of magnitude smaller than those presented in Fig. 14, independently of which mAIC is chosen for our bispectrum test for sub-optimal foreground extractions parameters.
Current usage metrics show cumulative count of Article Views (full-text article views including HTML views, PDF and ePub downloads, according to the available data) and Abstracts Views on Vision4Press platform.
Data correspond to usage on the plateform after 2015. The current usage metrics is available 48-96 hours after online publication and is updated daily on week days.
Initial download of the metrics may take a while.