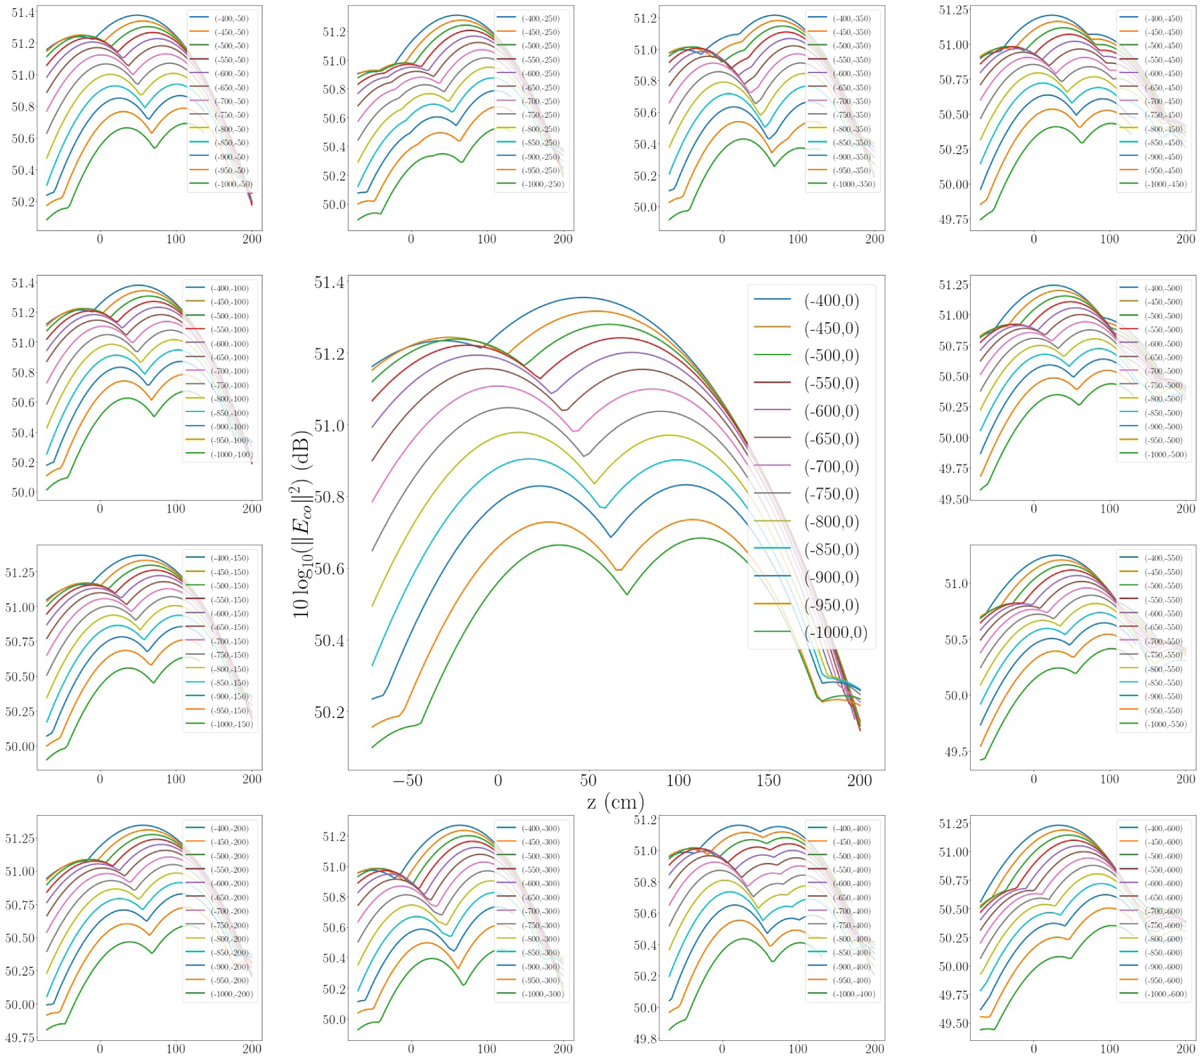
Fig. 8
Download original image
Evaluation of z parameter in relation to x coordinate for different y coordinates. The x values are between −1000 and −400 cm with 50 cm intervals for all plots. The y values are between −600 and 0 cm, starting in upper left plot and finishing in lower right plot. These values corresponds to critical region in focal plane for z parameters to obtain the fit.
Current usage metrics show cumulative count of Article Views (full-text article views including HTML views, PDF and ePub downloads, according to the available data) and Abstracts Views on Vision4Press platform.
Data correspond to usage on the plateform after 2015. The current usage metrics is available 48-96 hours after online publication and is updated daily on week days.
Initial download of the metrics may take a while.