Fig. C.2
Download original image
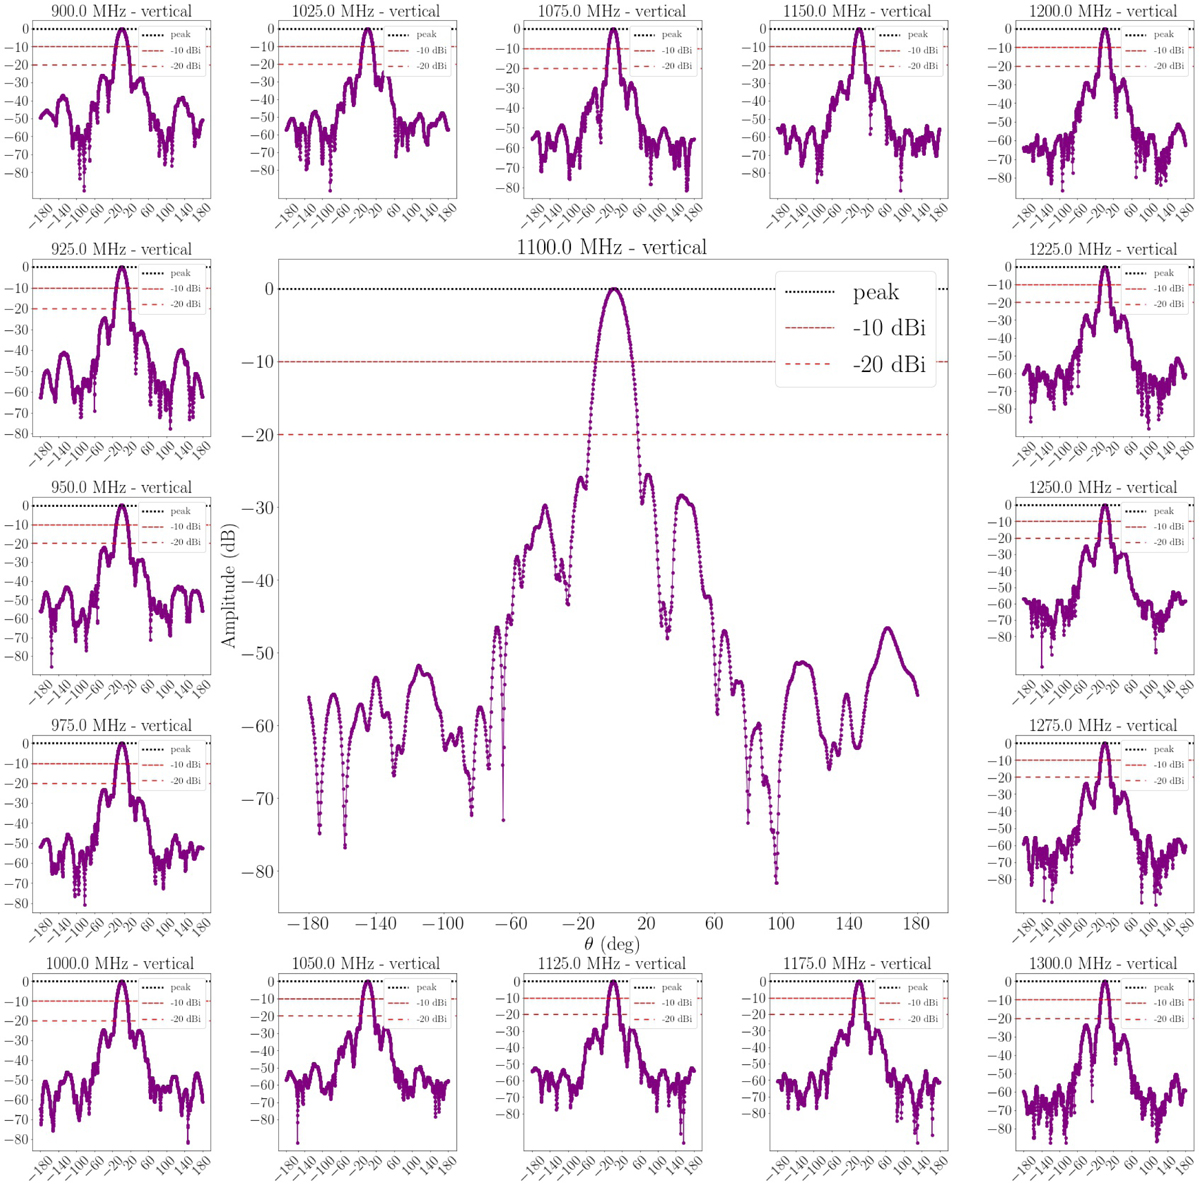
Plots from the horn beam measurements from Wuensche et al. (2020) used to obtain the 10–20 dB attenuation angles as a function of frequency for a vertically polarized input signal. For each plot the intensity is attenuated by 10 dB (red dashed line) and 20 dB (sparse red dashed line) in relation to the peak intensity (black dashed line).
Current usage metrics show cumulative count of Article Views (full-text article views including HTML views, PDF and ePub downloads, according to the available data) and Abstracts Views on Vision4Press platform.
Data correspond to usage on the plateform after 2015. The current usage metrics is available 48-96 hours after online publication and is updated daily on week days.
Initial download of the metrics may take a while.