Fig. 11
Download original image
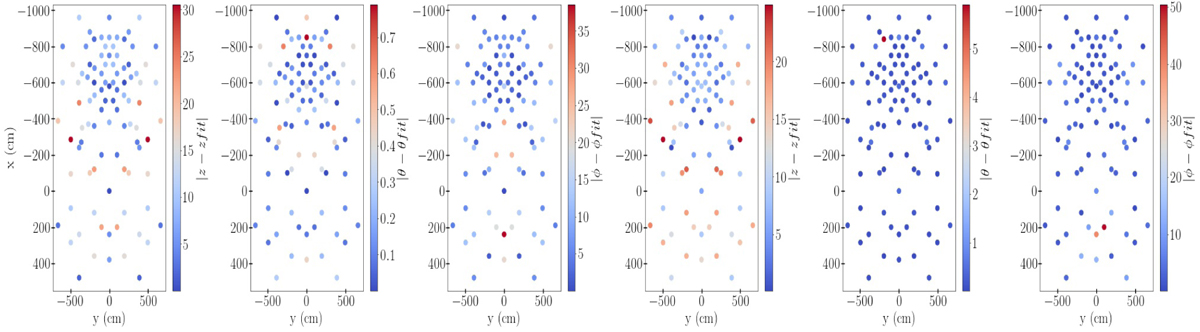
Comparison between parameters optimized and estimated by non-linear least-squares and dense neural network fits. Left: absolute difference between calibrated parameter values and fitting parameters. The first plot is the difference for the z parameter, the center plot is the difference for the θ parameter, and the last plot for ϕ. The fit used was that of Eq. (1) with values in Table 2. The vertical axis of the plots are x values in cm and horizontal axis, y in cm. Right: same analysis, but with a fit computed by a DNN.
Current usage metrics show cumulative count of Article Views (full-text article views including HTML views, PDF and ePub downloads, according to the available data) and Abstracts Views on Vision4Press platform.
Data correspond to usage on the plateform after 2015. The current usage metrics is available 48-96 hours after online publication and is updated daily on week days.
Initial download of the metrics may take a while.