Fig. 9.
Download original image
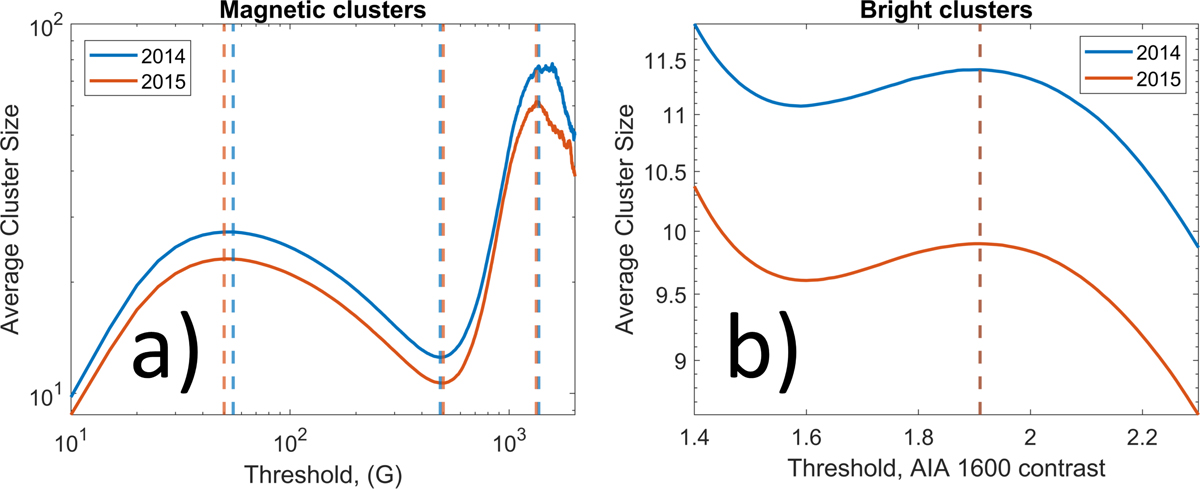
Average size of magnetic (panel a) and bright (panel b) clusters for a given threshold in images from 1 March 2014 to 31 December 2014 (blue) and 1 January 2015 to 31 December 2015 (orange). Vertical lines show locations of maxima and minima. For years when the strong field cluster peak is flatter we show the point where the average cluster size flattens.
Current usage metrics show cumulative count of Article Views (full-text article views including HTML views, PDF and ePub downloads, according to the available data) and Abstracts Views on Vision4Press platform.
Data correspond to usage on the plateform after 2015. The current usage metrics is available 48-96 hours after online publication and is updated daily on week days.
Initial download of the metrics may take a while.