Fig. 23.
Download original image
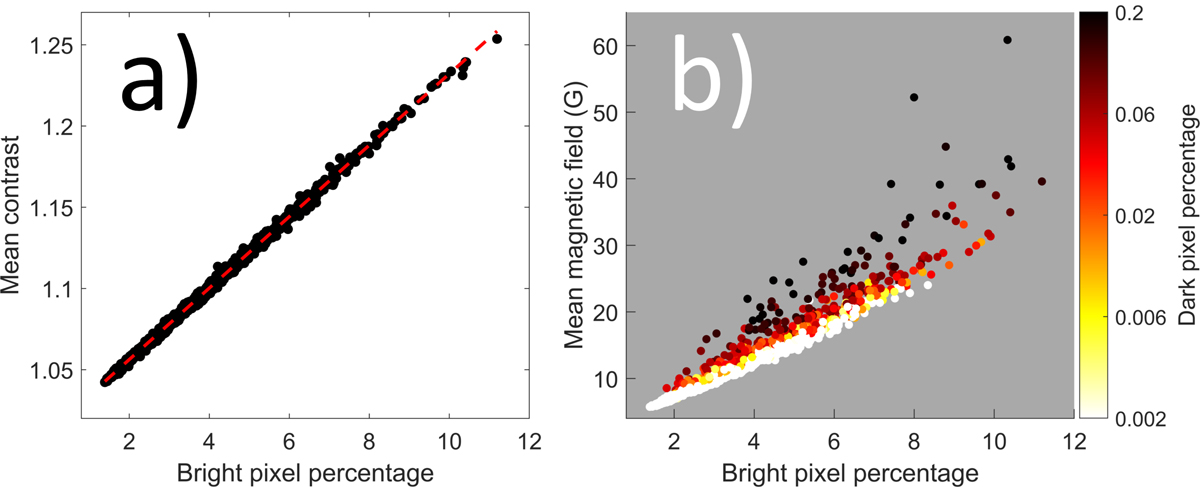
Bright pixel relations. (a) Mean AIA 1600 Å calibrated contrast as a function of bright pixel percentage. The red line shows the best least-squares regression line. The best-fit parameters are shown in Table 4. (b) Bright pixel percentage as a function of the mean unsigned magnetic field. The color of the points indicates the percentage of solar disk covered by the dark pixels (I < 0.5).
Current usage metrics show cumulative count of Article Views (full-text article views including HTML views, PDF and ePub downloads, according to the available data) and Abstracts Views on Vision4Press platform.
Data correspond to usage on the plateform after 2015. The current usage metrics is available 48-96 hours after online publication and is updated daily on week days.
Initial download of the metrics may take a while.