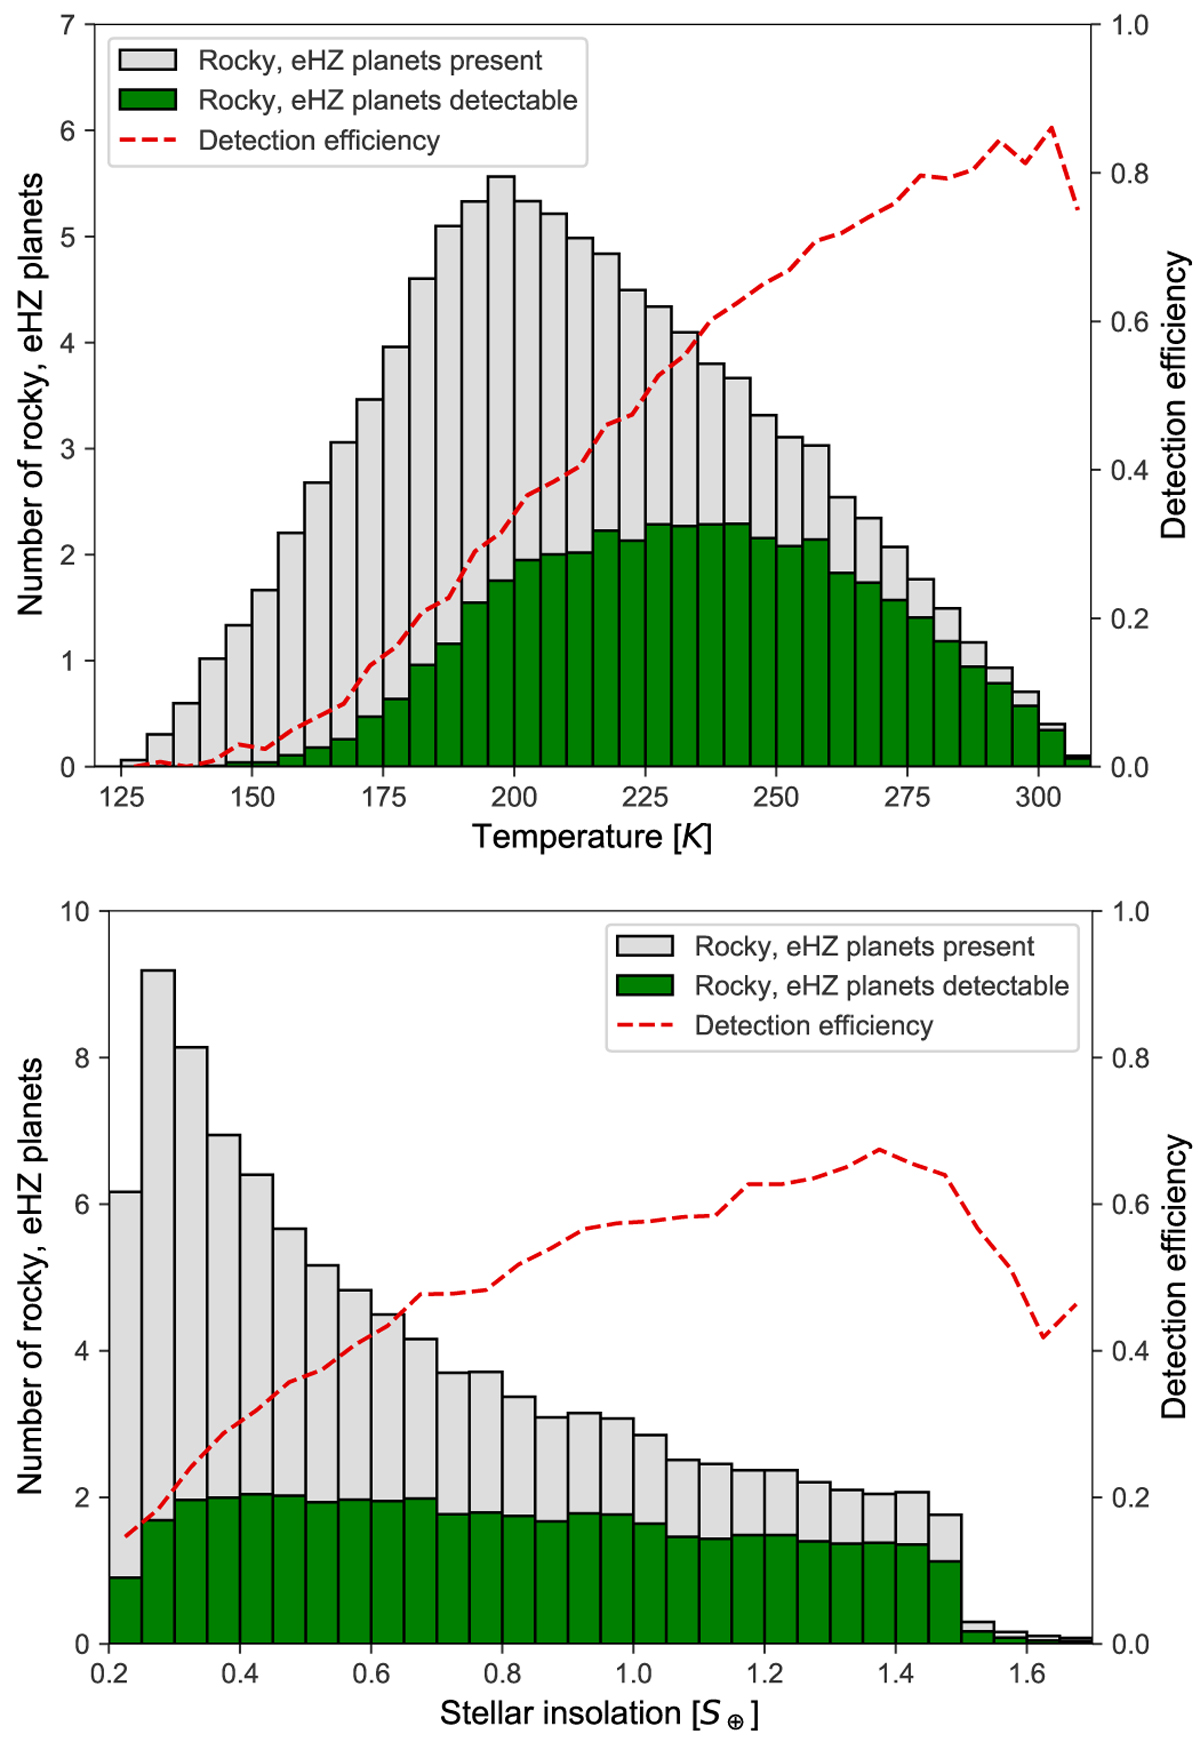
Fig. 7
Download original image
Detection efficiency for rocky eHZ exoplanets for our scenario 2. Top panel: equilibrium temperature distribution of all exoplanets present in the surveyed sample (gray) and all detected exoplanets (blue). Bottom panel: same as above, but as a function of stellar insolation. In both panels, the detection efficiency (y axis on the right-hand side) is shown with the dashed red line.
Current usage metrics show cumulative count of Article Views (full-text article views including HTML views, PDF and ePub downloads, according to the available data) and Abstracts Views on Vision4Press platform.
Data correspond to usage on the plateform after 2015. The current usage metrics is available 48-96 hours after online publication and is updated daily on week days.
Initial download of the metrics may take a while.