Free Access
Fig. 6
Download original image
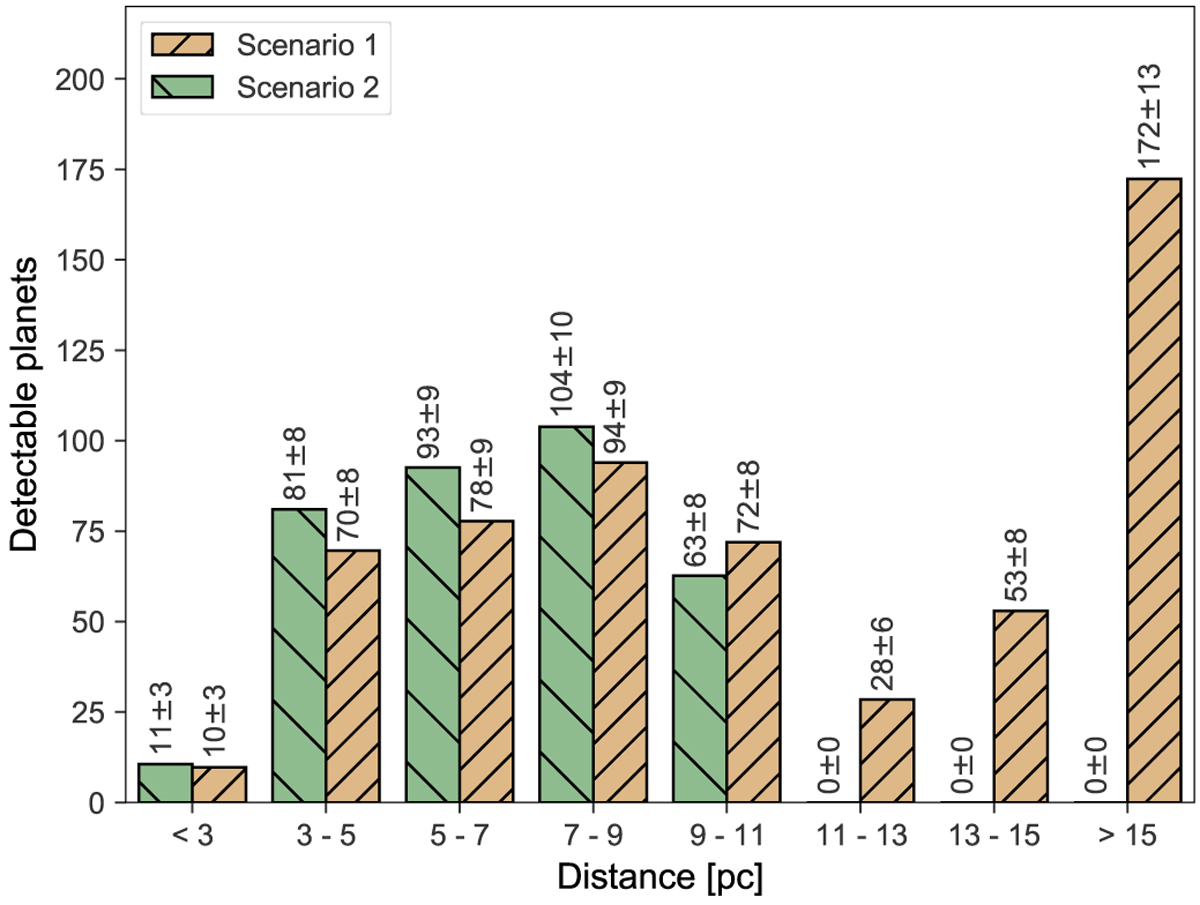
Distance distribution of the detected planet populations shown in Fig. 3. The bars show the number of expected planet detections, including the statistical 1 -σ uncertainty from the Monte Carlo approach but excluding uncertainties in the exoplanet occurrence rates.
Current usage metrics show cumulative count of Article Views (full-text article views including HTML views, PDF and ePub downloads, according to the available data) and Abstracts Views on Vision4Press platform.
Data correspond to usage on the plateform after 2015. The current usage metrics is available 48-96 hours after online publication and is updated daily on week days.
Initial download of the metrics may take a while.