Fig. 3
Download original image
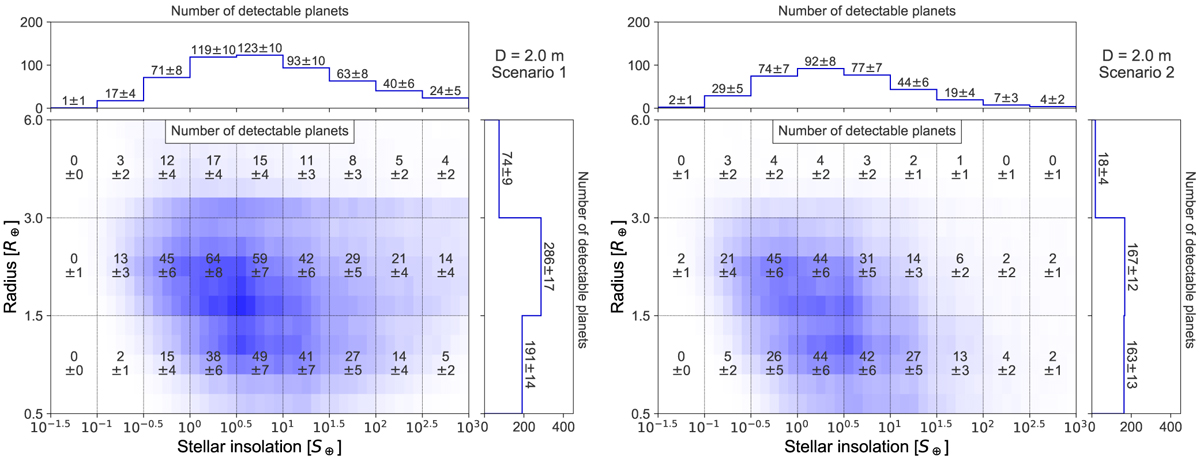
Total exoplanet detection yield from our reference case scenario simulations (D = 2m; λ = 4−18.5μm) in the radius vs. stellar insolation plane. The plots show the number of expected planet detections per grid cell, including the statistical 1−σ uncertainty from the Monte Carlo approach but excluding uncertainties in the exoplanet occurrence rates. Left panel: scenario 1 (search phase optimized for maximizing the total number of exoplanets). Right panel: scenario 2 (search phase optimized for maximizing the number of rocky eHZ exoplanets.)
Current usage metrics show cumulative count of Article Views (full-text article views including HTML views, PDF and ePub downloads, according to the available data) and Abstracts Views on Vision4Press platform.
Data correspond to usage on the plateform after 2015. The current usage metrics is available 48-96 hours after online publication and is updated daily on week days.
Initial download of the metrics may take a while.