Fig. 13
Download original image
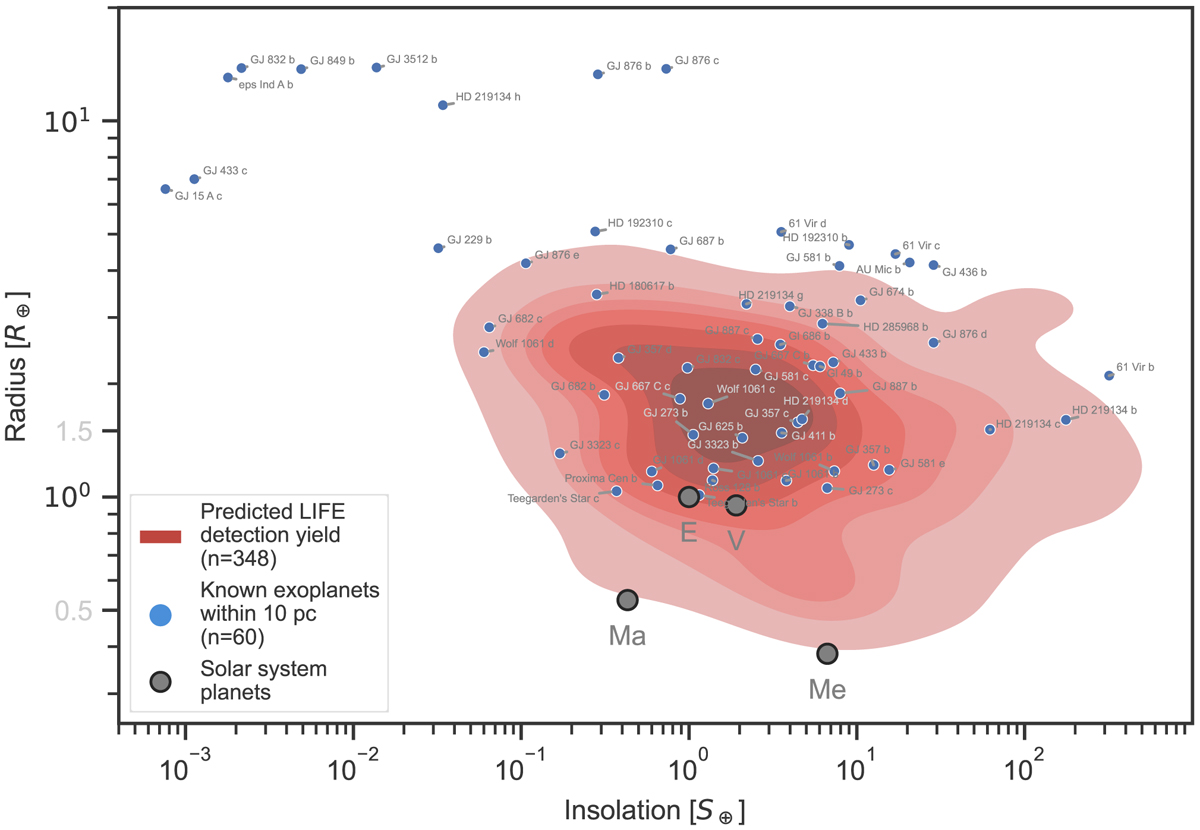
Comparison of exoplanet detections with LIFE to known Solar System planets and exoplanets. The LIFE yield for the reference case (scenario 2) is shown in red contours using a kernel density estimate of the detected sample. Every shaded contour level corresponds to 50 exoplanets detected in the respective parameter space. Blue points represent 60 out of the 79 known exoplanets within 10 pc of the Sun for which we could estimate the radius and insolation level. Gray points represent the four rocky planets in the Solar System (E = Earth, V=Venus, Ma = Mars, and Me = Mercury).
Current usage metrics show cumulative count of Article Views (full-text article views including HTML views, PDF and ePub downloads, according to the available data) and Abstracts Views on Vision4Press platform.
Data correspond to usage on the plateform after 2015. The current usage metrics is available 48-96 hours after online publication and is updated daily on week days.
Initial download of the metrics may take a while.