Fig. 12
Download original image
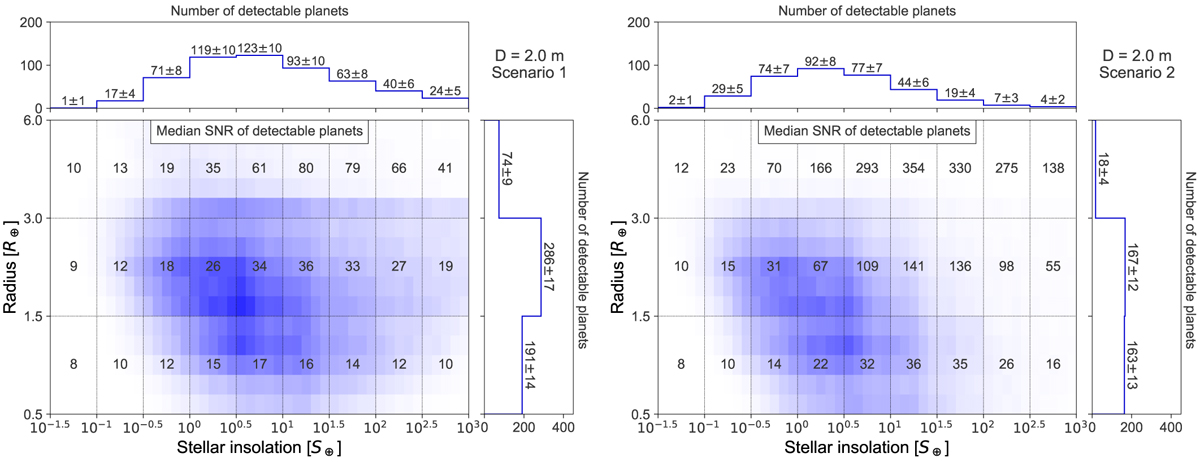
Median S/N of the detected exoplanets in our reference case scenario simulations in the radius vs. stellar insolation plane (left panel: scenario 1; right panel: scenario 2). We note that the ID distributions on top and to the right of the grids (as well as colored area) represent the numbers of detected exoplanets, including the 1-σ uncertainties shown in Fig. 3, and not the marginalized distributions of the S/N.
Current usage metrics show cumulative count of Article Views (full-text article views including HTML views, PDF and ePub downloads, according to the available data) and Abstracts Views on Vision4Press platform.
Data correspond to usage on the plateform after 2015. The current usage metrics is available 48-96 hours after online publication and is updated daily on week days.
Initial download of the metrics may take a while.