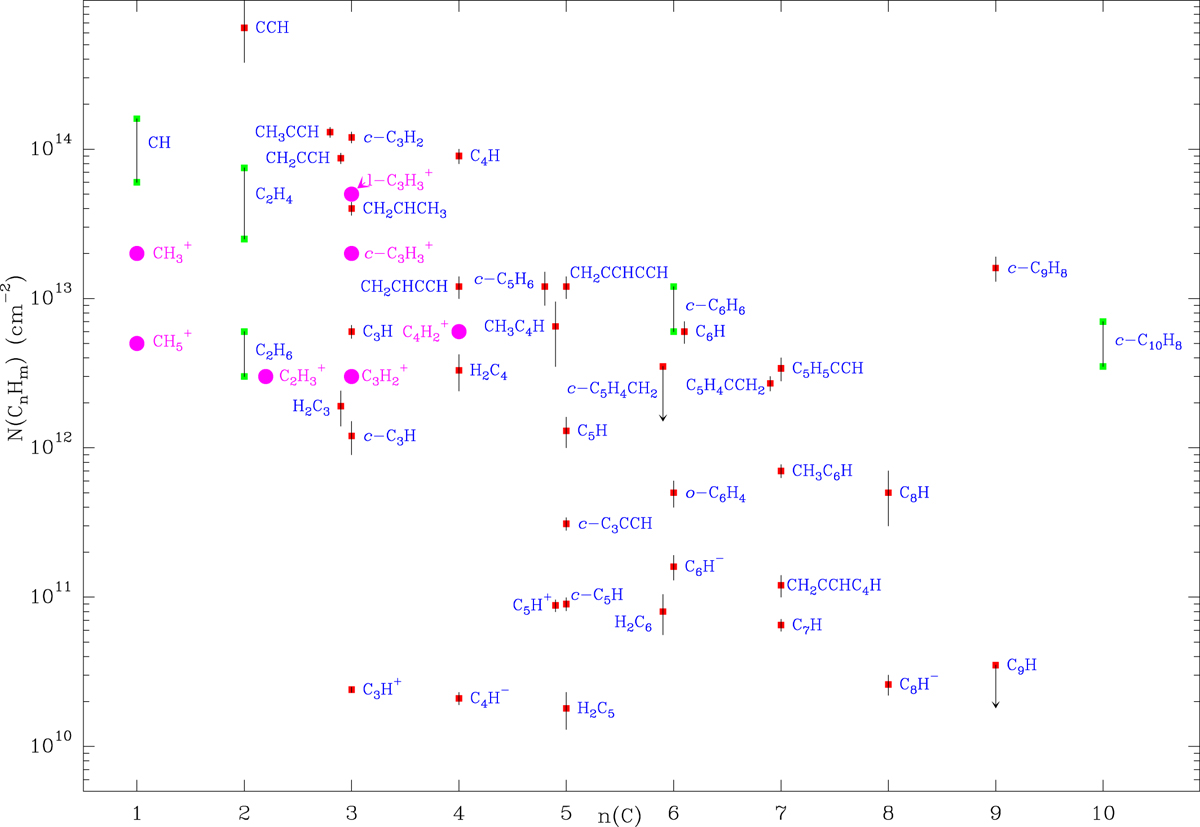
Fig. 5.
Download original image
Graphic representation of the abundances of CnHm hydrocarbons from Table A.1. The abscissa corresponds to the number of carbon atoms in the molecule and the ordinate to the column density of each hydrocarbon. For species whose abundance has been estimated from cyano derivatives the upper and lower ranges are indicated by two green squares. For the other species the abundance is indicated by a single red square and the error is represented by a vertical black line. Abundances of the most abundant cations, according to the chemical model (see text), are indicated in magenta.
Current usage metrics show cumulative count of Article Views (full-text article views including HTML views, PDF and ePub downloads, according to the available data) and Abstracts Views on Vision4Press platform.
Data correspond to usage on the plateform after 2015. The current usage metrics is available 48-96 hours after online publication and is updated daily on week days.
Initial download of the metrics may take a while.