Fig. 5.
Download original image
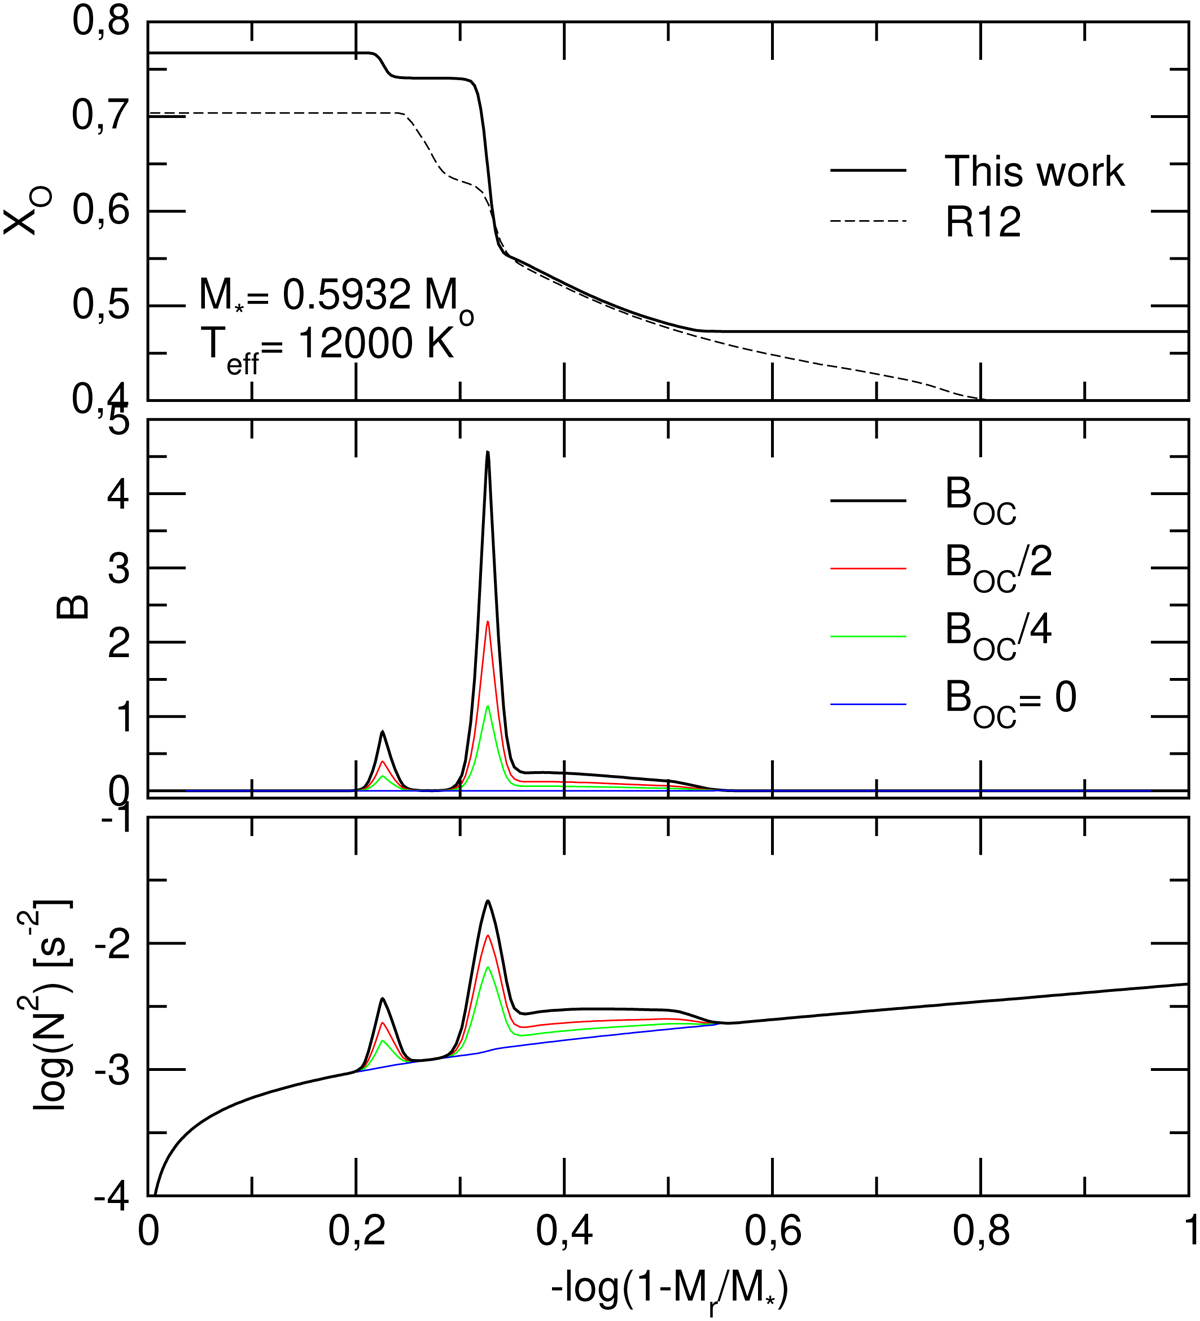
Main differences in the properties of the core of the models between the present calculations and those of R12. Upper panel: chemical profile of O at the CO-core regions of a DA WD model with M⋆ = 0.5932 M⊙, Teff ∼ 12 000 K, and a thick H envelope, for the case of the present calculations (solid black line) and the R12 computations (dashed black line). Middle panel: Ledoux term B at the region of the O/C interface, BOC, of the same model depicted in the upper panel, along with the artificial situations of BOC/2, BOC/4, and BOC = 0. Lower panel: logarithm of the squared Brunt–Väisälä frequency for the same cases considered in the middle panel.
Current usage metrics show cumulative count of Article Views (full-text article views including HTML views, PDF and ePub downloads, according to the available data) and Abstracts Views on Vision4Press platform.
Data correspond to usage on the plateform after 2015. The current usage metrics is available 48-96 hours after online publication and is updated daily on week days.
Initial download of the metrics may take a while.