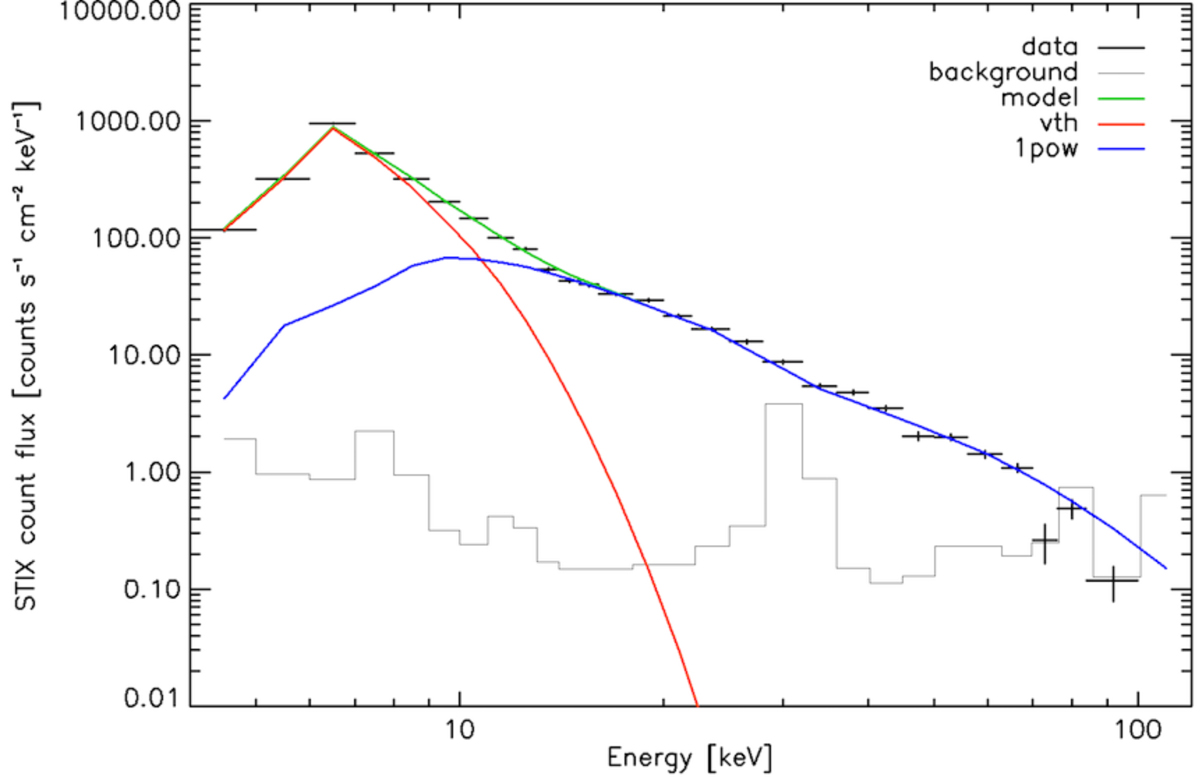
Fig. 8.
Download original image
X-ray count flux spectrum from STIX observations, at 15:27:59 UT with an integration over 0.5 s. The observed count flux is shown by the thick black crosses, the pre-flare background spectrum is shown by the thin black line, and the fitted spectrum is shown by the green line. The thermal component of the fitted model is shown in red, and the non-thermal power-law component is shown in blue.
Current usage metrics show cumulative count of Article Views (full-text article views including HTML views, PDF and ePub downloads, according to the available data) and Abstracts Views on Vision4Press platform.
Data correspond to usage on the plateform after 2015. The current usage metrics is available 48-96 hours after online publication and is updated daily on week days.
Initial download of the metrics may take a while.