Open Access
Fig. 6.
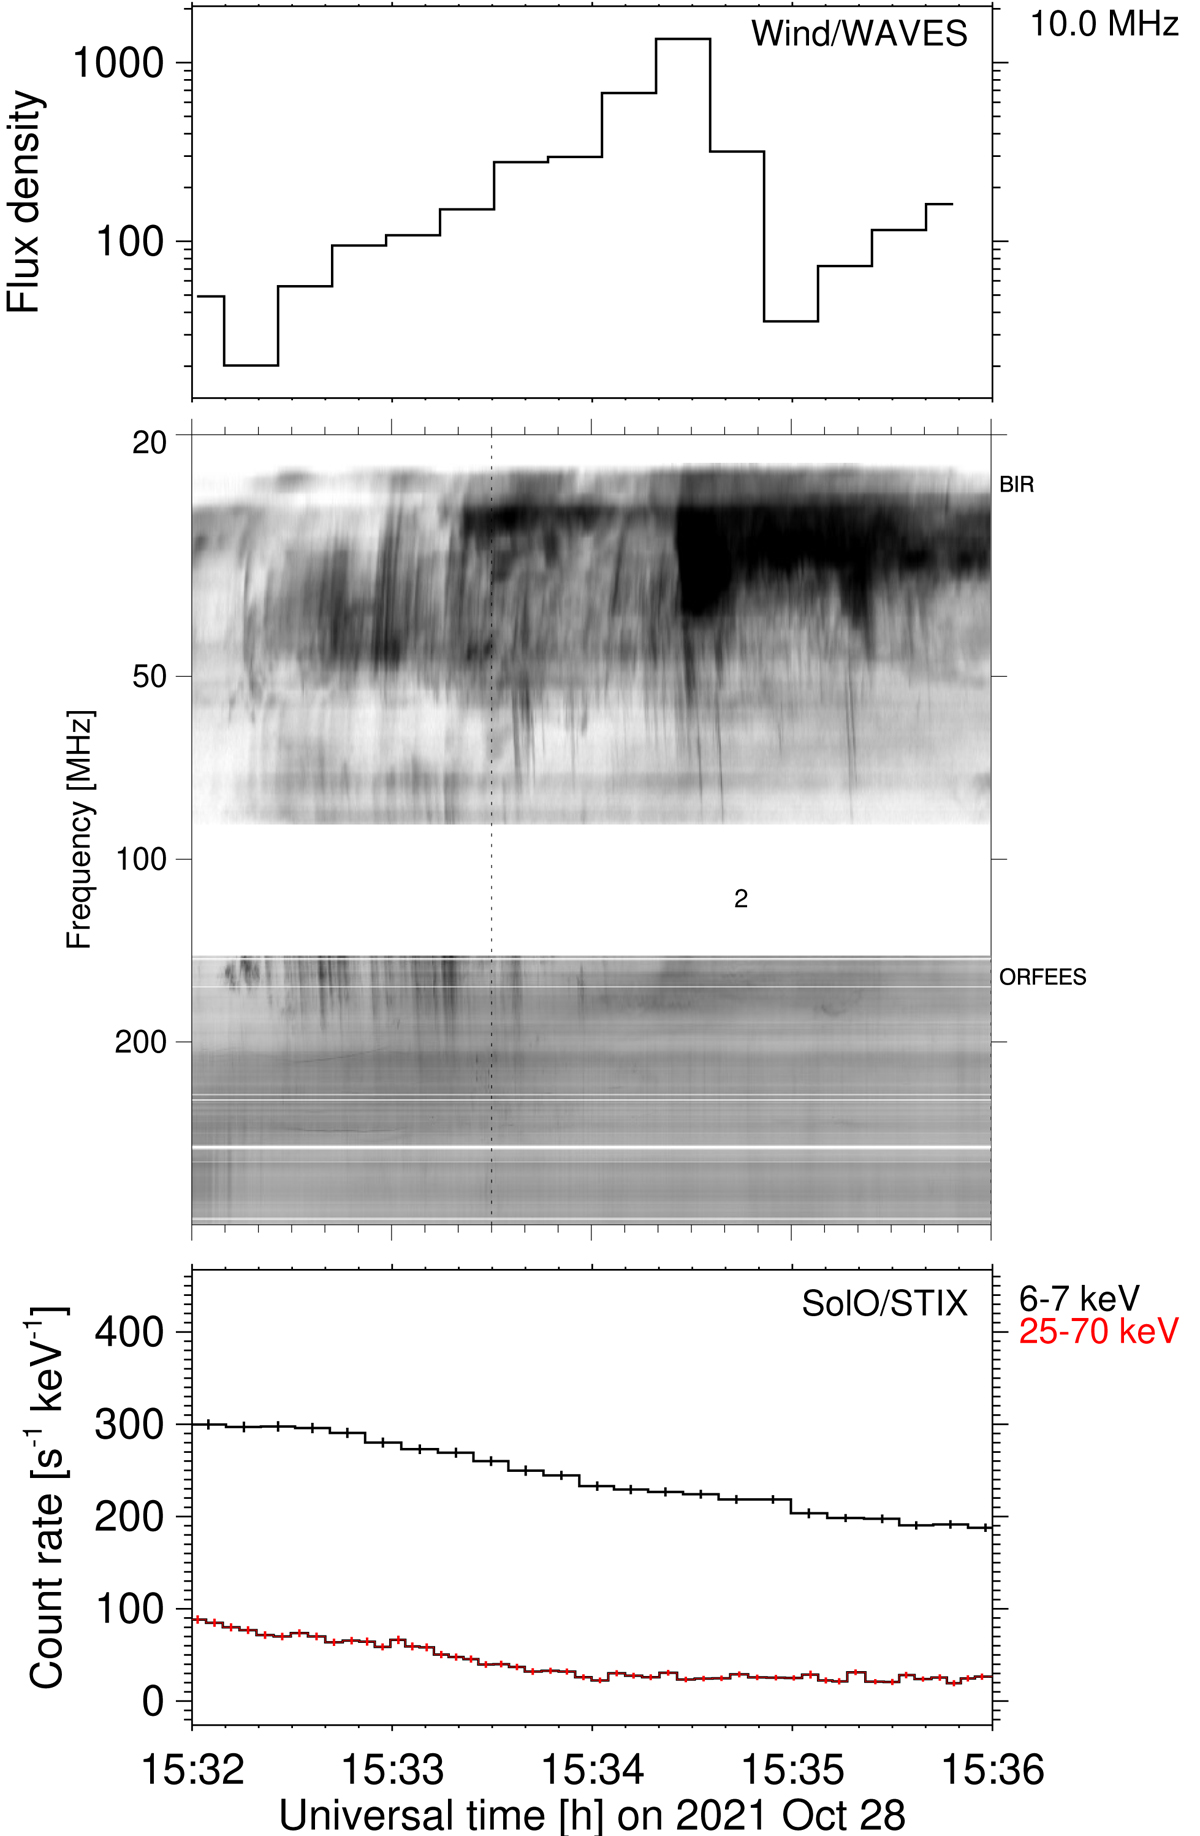
Download original image
Light curves of radio emission at decametre-λ (top), dynamic spectrogram at m-λ (centre), and X-ray light curves (bottom) during the second DH type III group on 2021 Oct. 28, which starts at the vertical dashed line (see Fig. 2).
Current usage metrics show cumulative count of Article Views (full-text article views including HTML views, PDF and ePub downloads, according to the available data) and Abstracts Views on Vision4Press platform.
Data correspond to usage on the plateform after 2015. The current usage metrics is available 48-96 hours after online publication and is updated daily on week days.
Initial download of the metrics may take a while.