Fig. 4.
Download original image
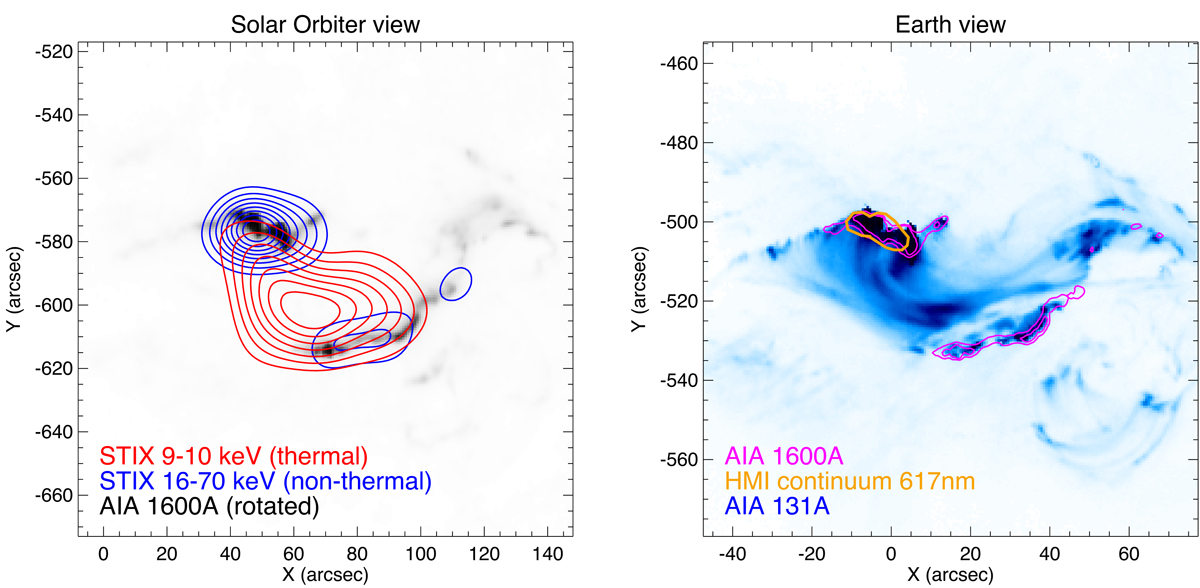
Images of the flaring region in the chromosphere and low solar corona taken during the impulsive phase as seen from Solar Orbiter vantage point (left) and from Earth (right). On the left, STIX X-ray contours (15:27:24.6–15:28:09.6 UT) are plotted on top of a rotated AIA 1600A image (15:27:50.130 UT). The blue contours (20% through 90% at 10% spacing) correspond to the non-thermal emissions from the flare ribbon outlining the main source of precipitation of flare-accelerated electrons. The non-thermal sources are well correlated with the locations of the main UV 1600A sources. Thermal X-ray emissions (contours from 30% to 90%) are seen from loops connecting the hard X-ray sources. From Earth view (right), the AIA 131A image from 15:28:06.620 UT shows both the flare ribbons as well as the loops connecting the ribbons. For reference with the Solar Orbiter view, the AIA1600A are shown as magenta contours (20% and 50% levels). HMI continuum observations reveal a white light flare source (orange contours at 80% of the peak value at 15:28:12 UT), but only the northern ribbon is seen while the signal-to-noise ratio of the southern ribbon appears to be too low to be visible above the non-flare related solar variations detected by HMI.
Current usage metrics show cumulative count of Article Views (full-text article views including HTML views, PDF and ePub downloads, according to the available data) and Abstracts Views on Vision4Press platform.
Data correspond to usage on the plateform after 2015. The current usage metrics is available 48-96 hours after online publication and is updated daily on week days.
Initial download of the metrics may take a while.