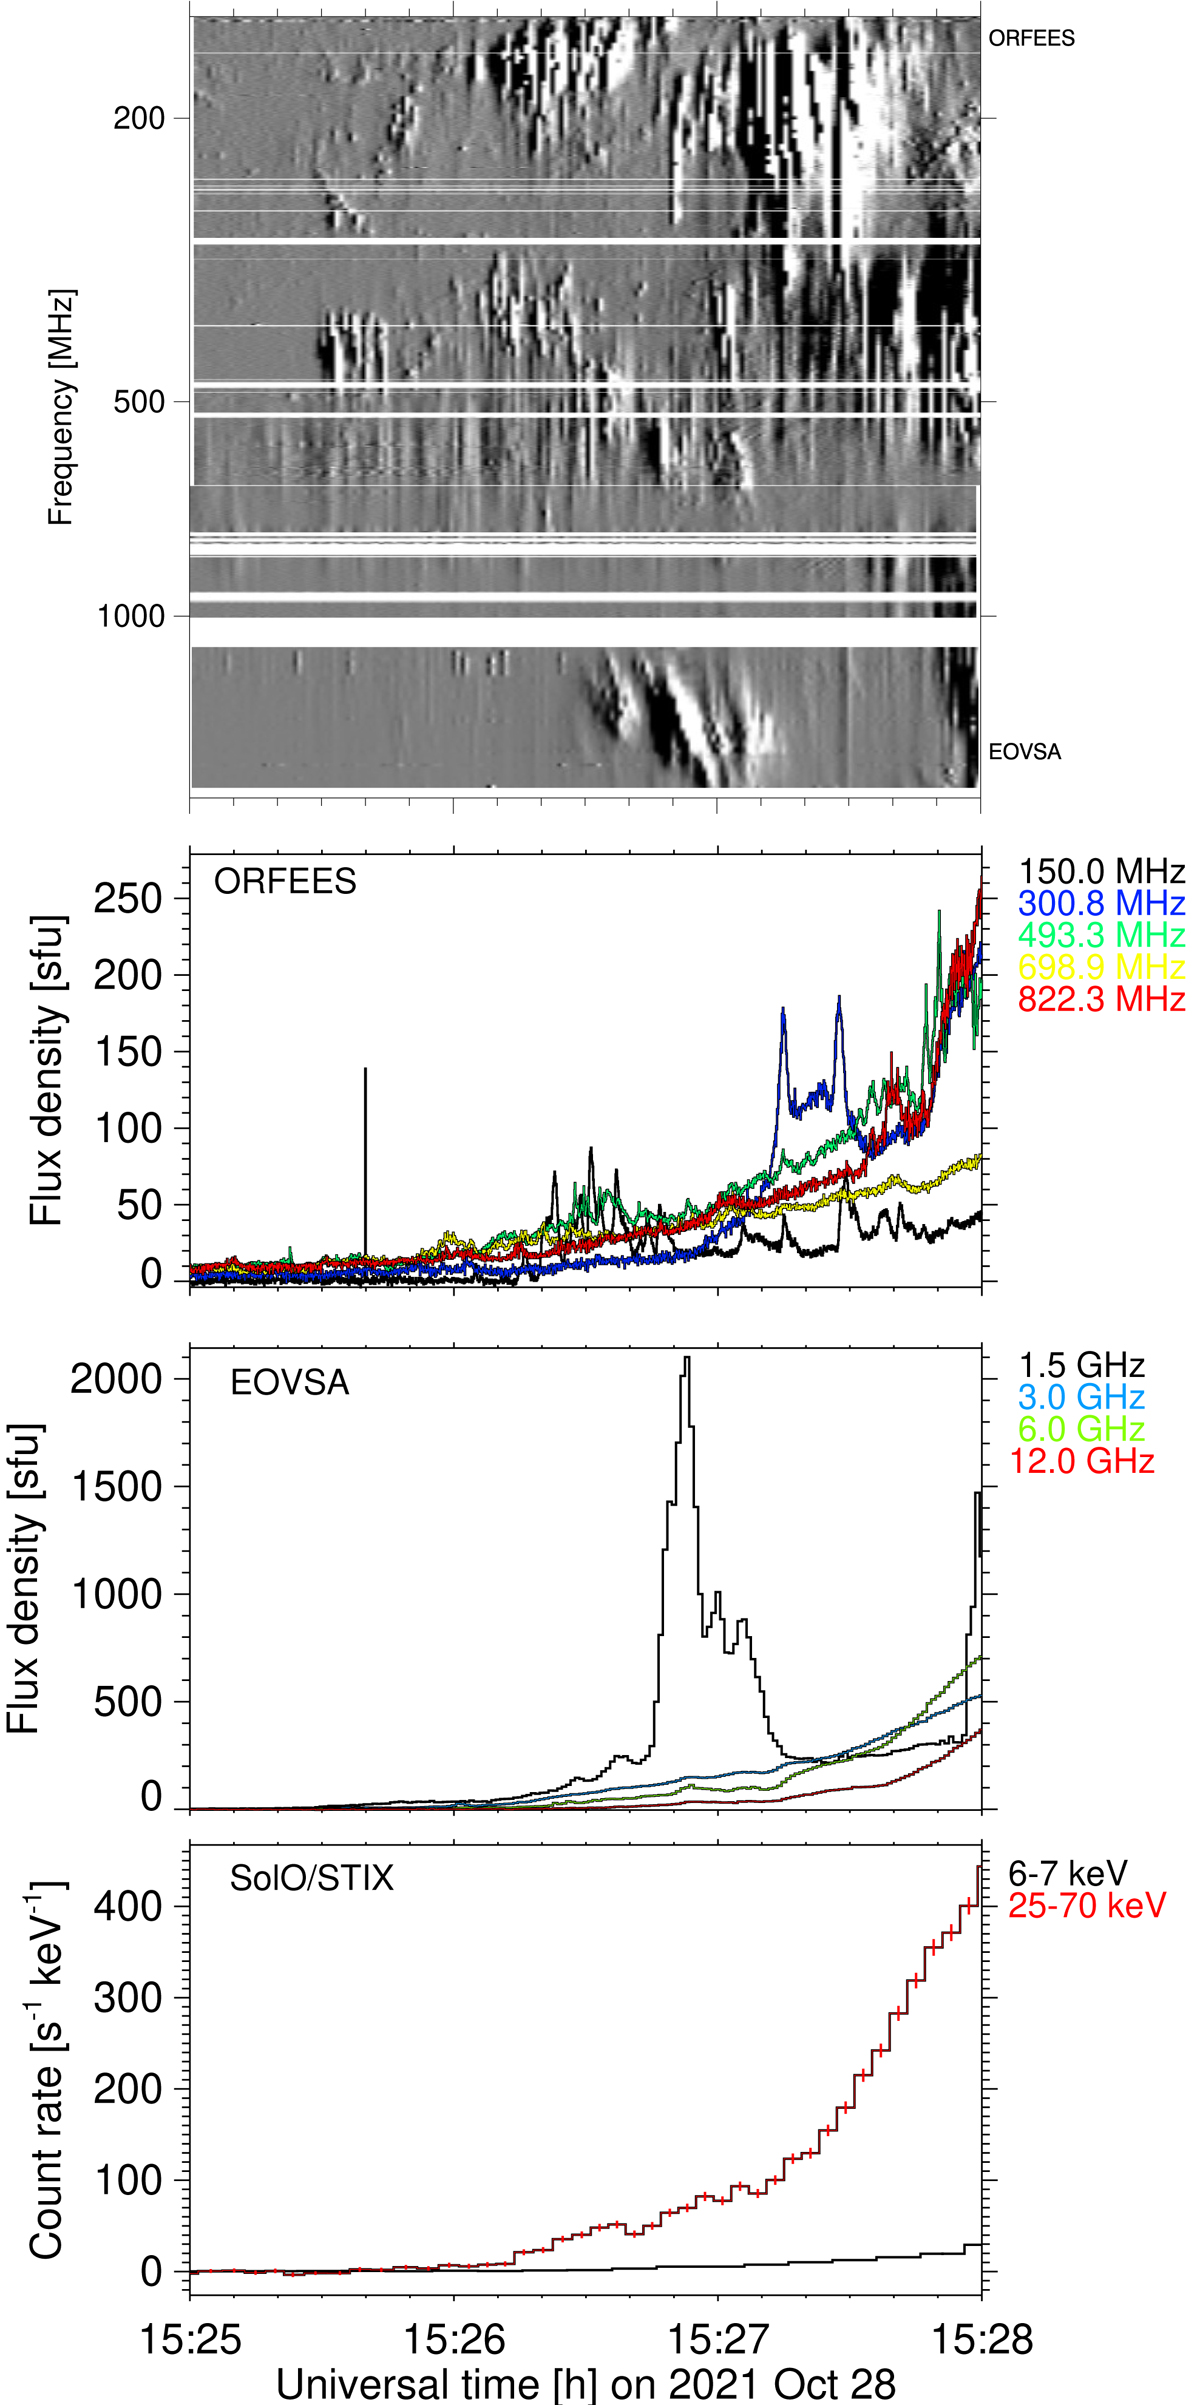
Fig. 3.
Download original image
Time-difference dynamic spectrogram (running difference spectra at 0.1 s time resolution for ORFEES and 1 s for EOVSA) in the range 144–1800 MHz, microwave (middle panel) and X-ray light curves (bottom panel) during the early phase of the radio event. The horizontal lines in the ORFEES spectrum and the vertical bars in the EOVSA spectrum between 1100 and 1200 MHz are terrestrial interference.
Current usage metrics show cumulative count of Article Views (full-text article views including HTML views, PDF and ePub downloads, according to the available data) and Abstracts Views on Vision4Press platform.
Data correspond to usage on the plateform after 2015. The current usage metrics is available 48-96 hours after online publication and is updated daily on week days.
Initial download of the metrics may take a while.