Fig. 2.
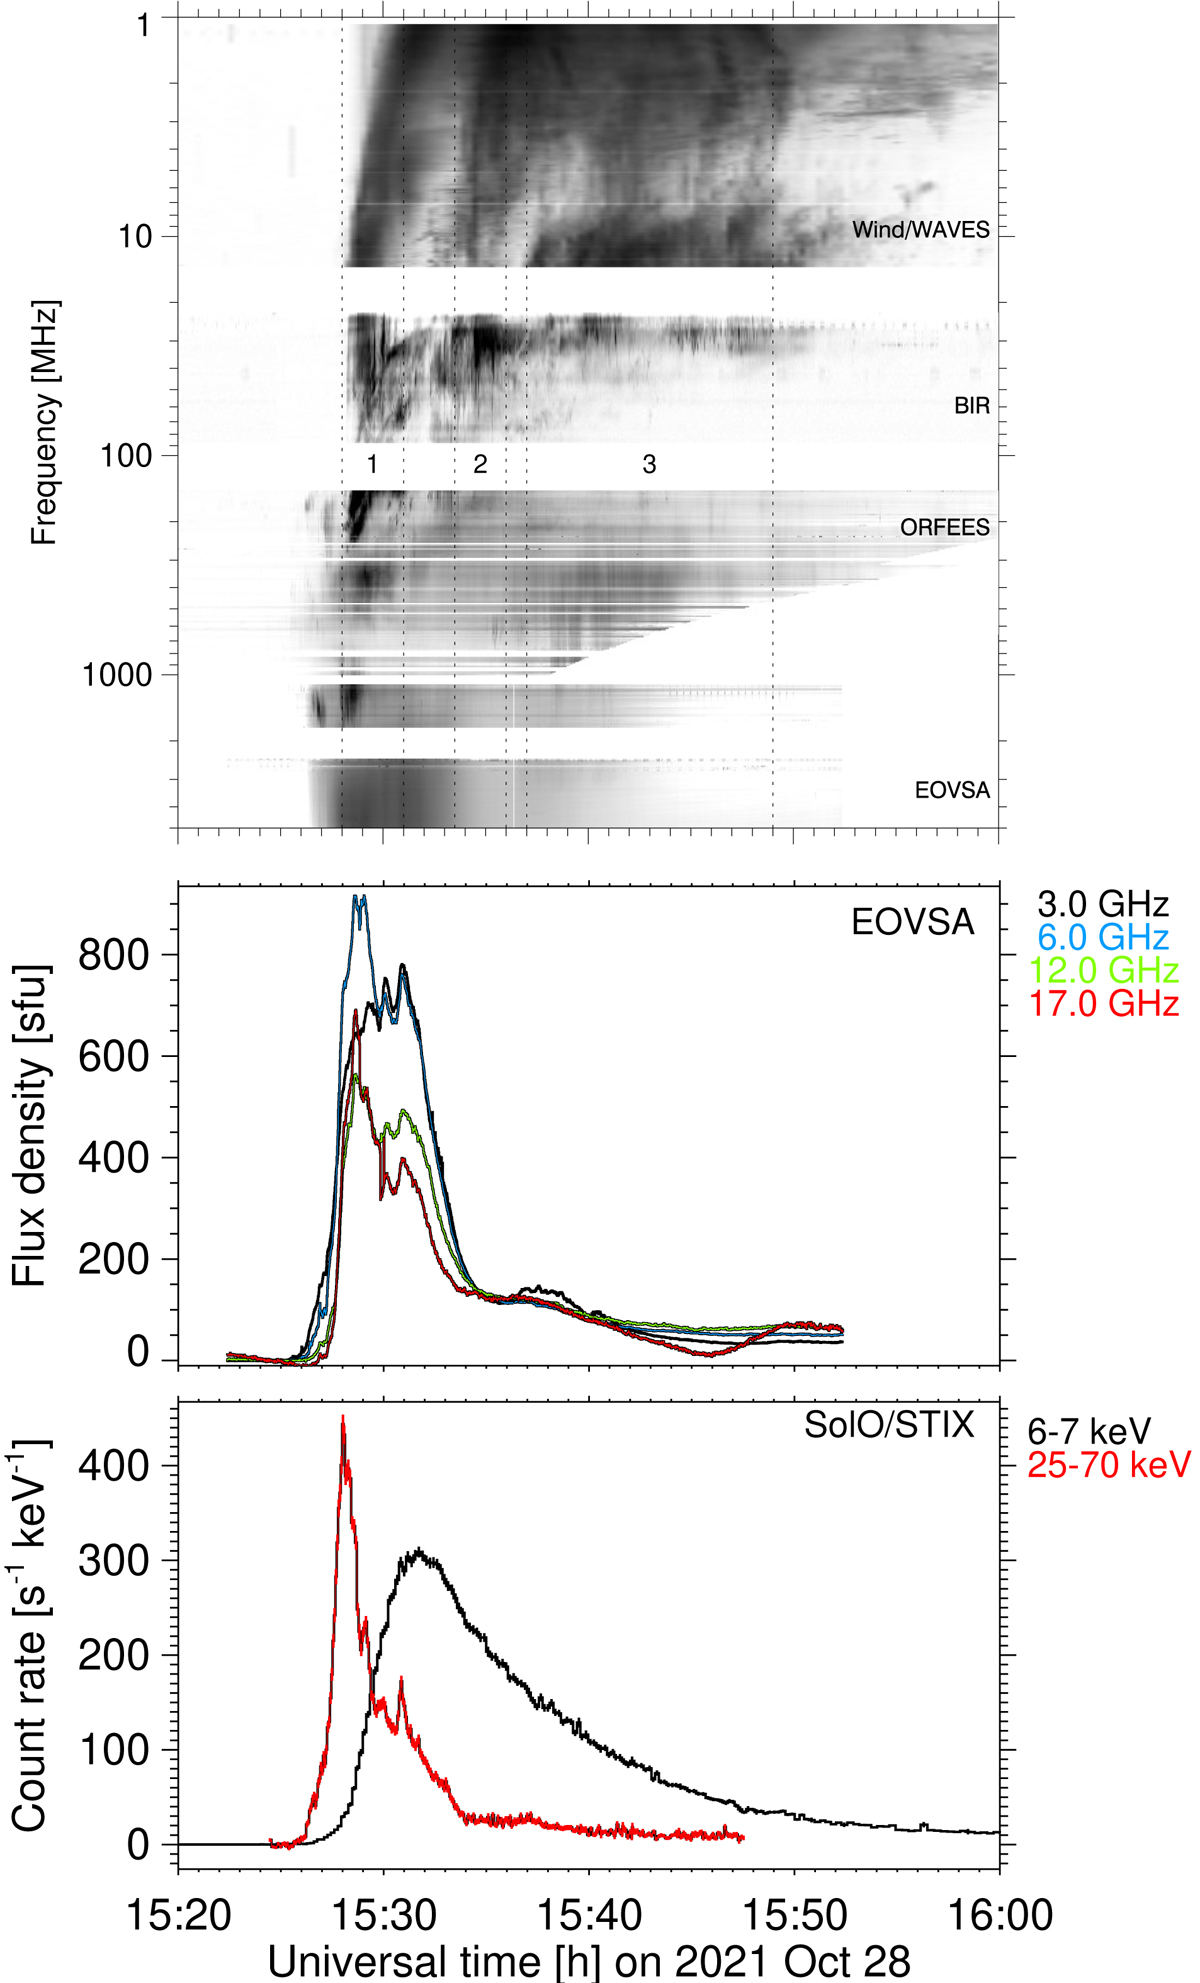
Download original image
Overview of the radio and X-ray emissions associated with the GLE on 2021 Oct. 28. Top: dynamic spectrogram in the range 1–5000 MHz observed by EOVSA, ORFEES, the e-Callisto station at Birr Castle (Ireland), and Wind/WAVES/RAD2. Middle: EOVSA light curves at four microwave frequencies. Bottom: solar Orbiter/STIX light curves in thermal (black) and non-thermal (red) X-rays. The vertical dashed lines delimit three numbered intervals of DH type III bursts.
Current usage metrics show cumulative count of Article Views (full-text article views including HTML views, PDF and ePub downloads, according to the available data) and Abstracts Views on Vision4Press platform.
Data correspond to usage on the plateform after 2015. The current usage metrics is available 48-96 hours after online publication and is updated daily on week days.
Initial download of the metrics may take a while.