Open Access
Fig. A.1.
Download original image
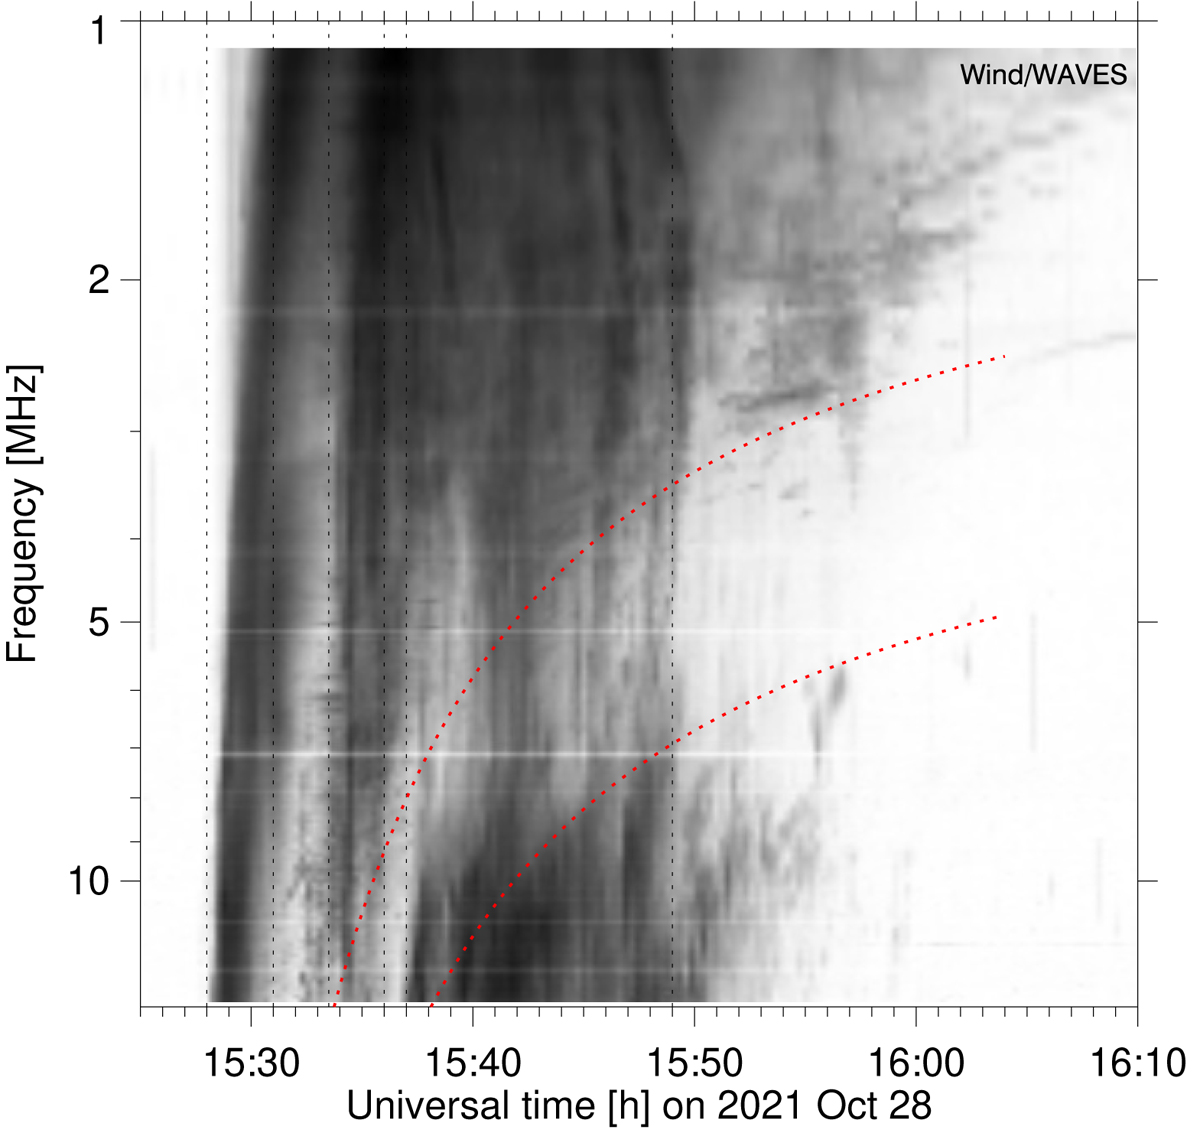
Dynamic spectrogram from 14 to 1 MHz with overlaid tracks (dashed red curves) of the fundamental and harmonic bands of a model type II burst. See text for details.
Current usage metrics show cumulative count of Article Views (full-text article views including HTML views, PDF and ePub downloads, according to the available data) and Abstracts Views on Vision4Press platform.
Data correspond to usage on the plateform after 2015. The current usage metrics is available 48-96 hours after online publication and is updated daily on week days.
Initial download of the metrics may take a while.