Fig. 1.
Download original image
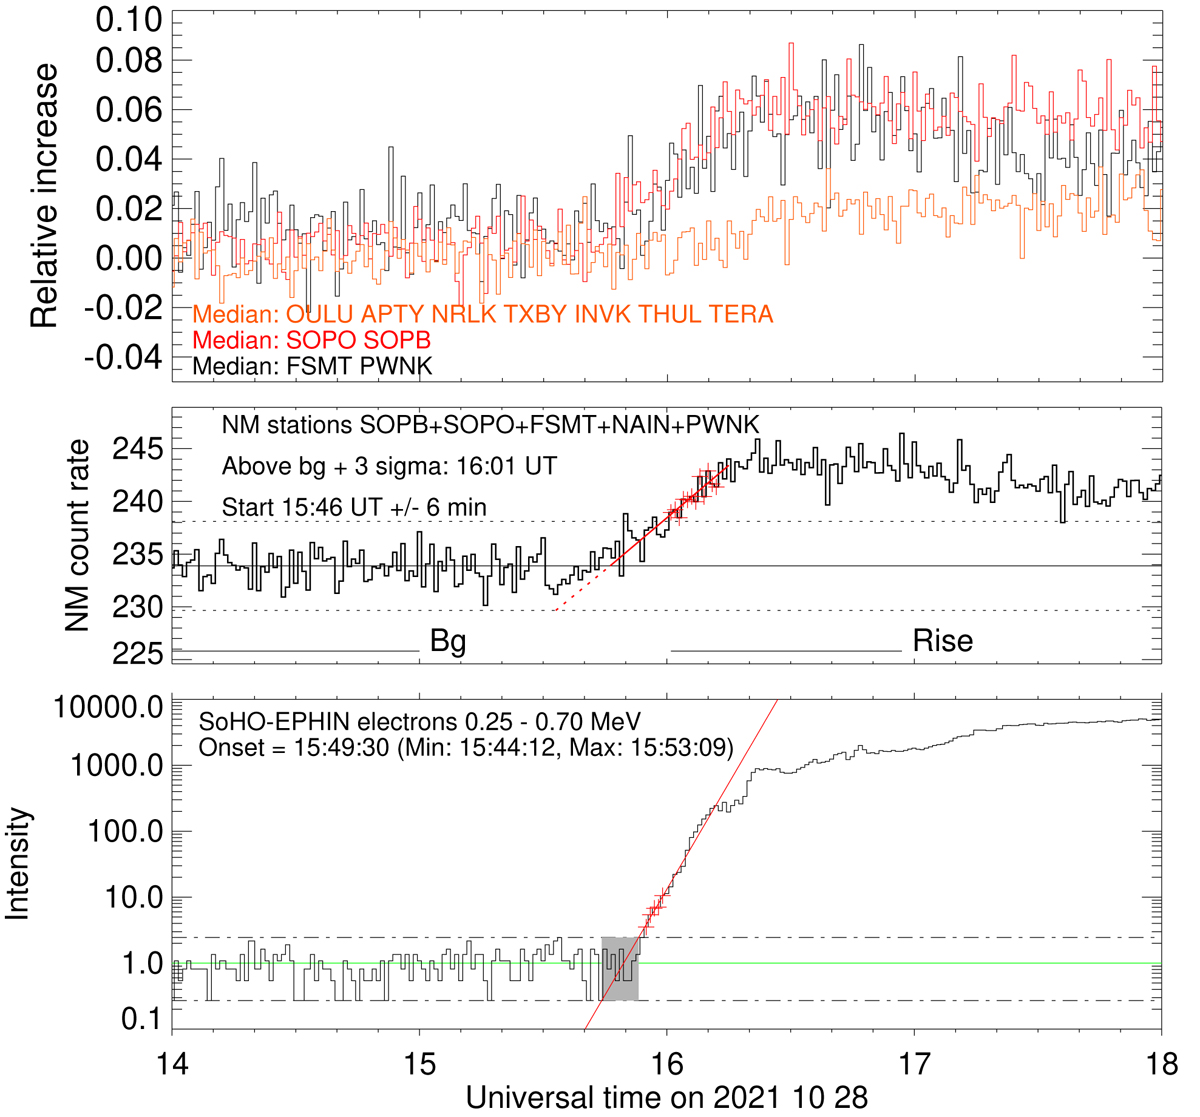
Time histories of the mean count rates of high-latitude neutron monitors (top and central panel) and of the intensity in the nominal (250–700) keV channel of SoHO/EPHIN (bottom). Horizontal lines in the central and bottom panels mark the constant background levels (solid) and the background ±3σ levels (dashed). The red lines on the rising part of the profiles show linear fits to the logarithm of the count rate vs. time, the red plus-signs are the data points above background +3σ used for the fits. The start times are the times when the straight line fits intersect the background. The quoted earliest and last possible onset times refer to the intersection of this fit with the background ±3σ.
Current usage metrics show cumulative count of Article Views (full-text article views including HTML views, PDF and ePub downloads, according to the available data) and Abstracts Views on Vision4Press platform.
Data correspond to usage on the plateform after 2015. The current usage metrics is available 48-96 hours after online publication and is updated daily on week days.
Initial download of the metrics may take a while.