Open Access
Fig. 7
Download original image
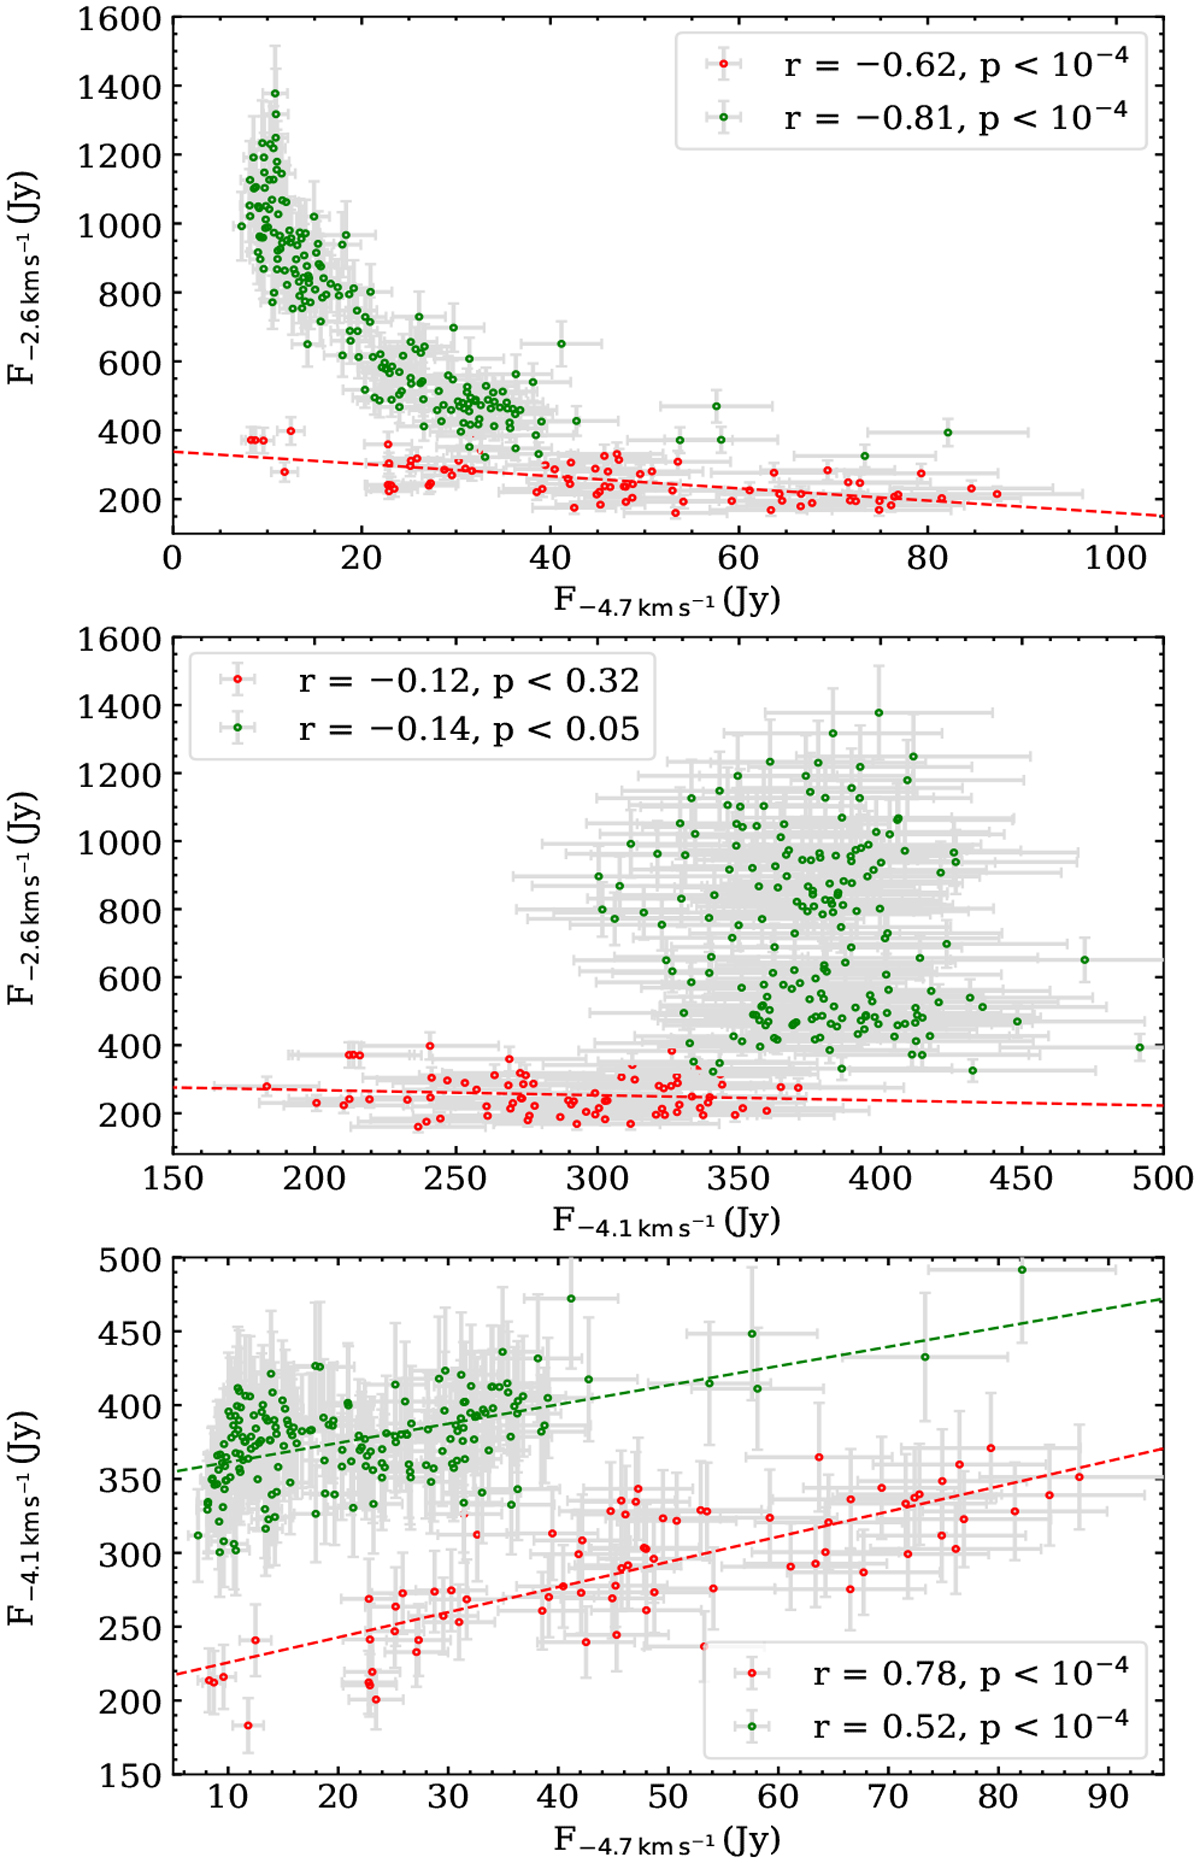
Comparison of peak flux densities of the selected features. Red and green points refer to measurements from intervals of MJD 56 057–56 347 (similarly as in Szymczak et al. 2014) and MJD 57 862–58 851, respectively. The dashed lines mark the best fit of the linear function.
Current usage metrics show cumulative count of Article Views (full-text article views including HTML views, PDF and ePub downloads, according to the available data) and Abstracts Views on Vision4Press platform.
Data correspond to usage on the plateform after 2015. The current usage metrics is available 48-96 hours after online publication and is updated daily on week days.
Initial download of the metrics may take a while.