Fig. 4

Download original image
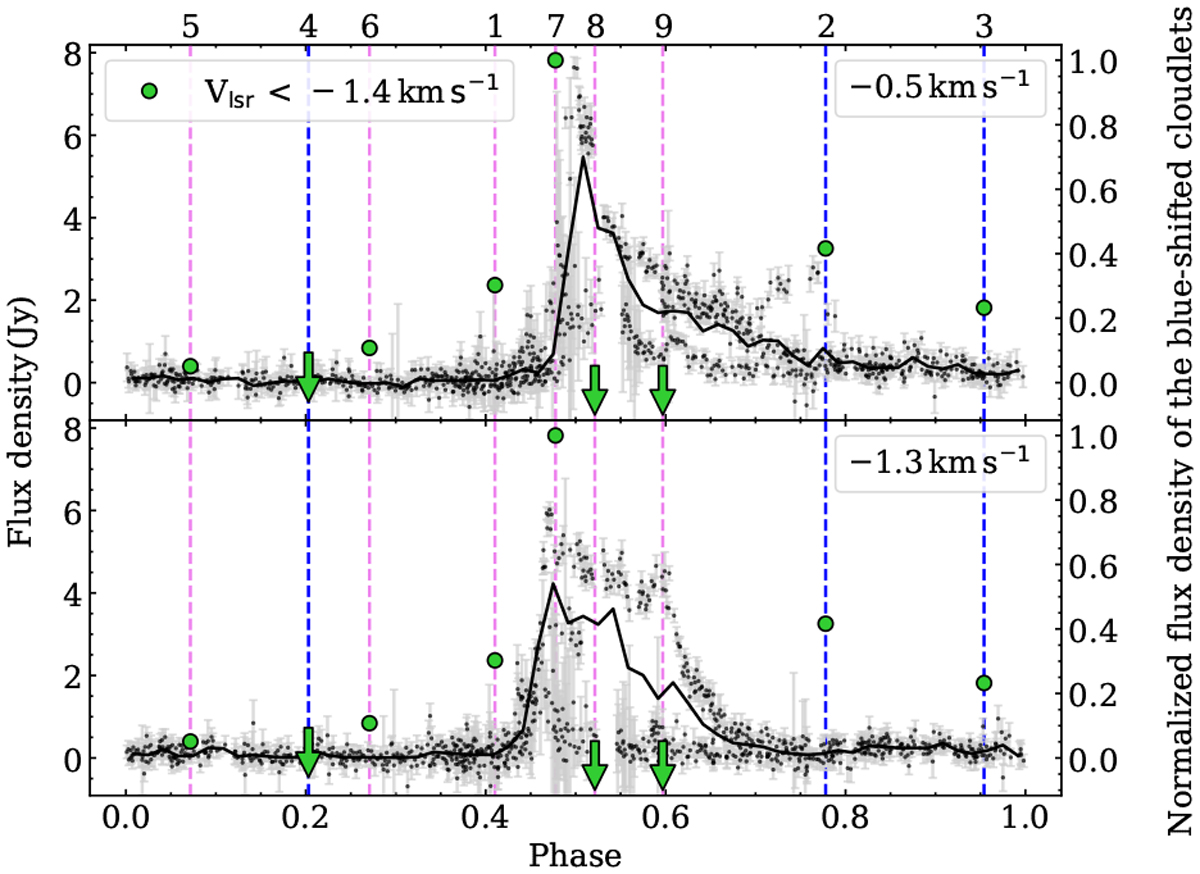
Folded light curves of the redshifted flaring emission for −0.5 (top) and −1.3 km s−1 (bottom) features. The data points are black with grey error bars, while the black solid lines show the average profiles. Green points refer to the relative intensities of the blueshifted emission observable in cluster II; arrows mark upper limits for the blueshifted emission in epochs with no detection. The vertical dashed lines correspond to the computed phases of VLBI observations (magenta – EVN, blue – JVN); the epoch numbers (Table 1) are given above the top abscissa.
Current usage metrics show cumulative count of Article Views (full-text article views including HTML views, PDF and ePub downloads, according to the available data) and Abstracts Views on Vision4Press platform.
Data correspond to usage on the plateform after 2015. The current usage metrics is available 48-96 hours after online publication and is updated daily on week days.
Initial download of the metrics may take a while.


