Fig. 2
Download original image
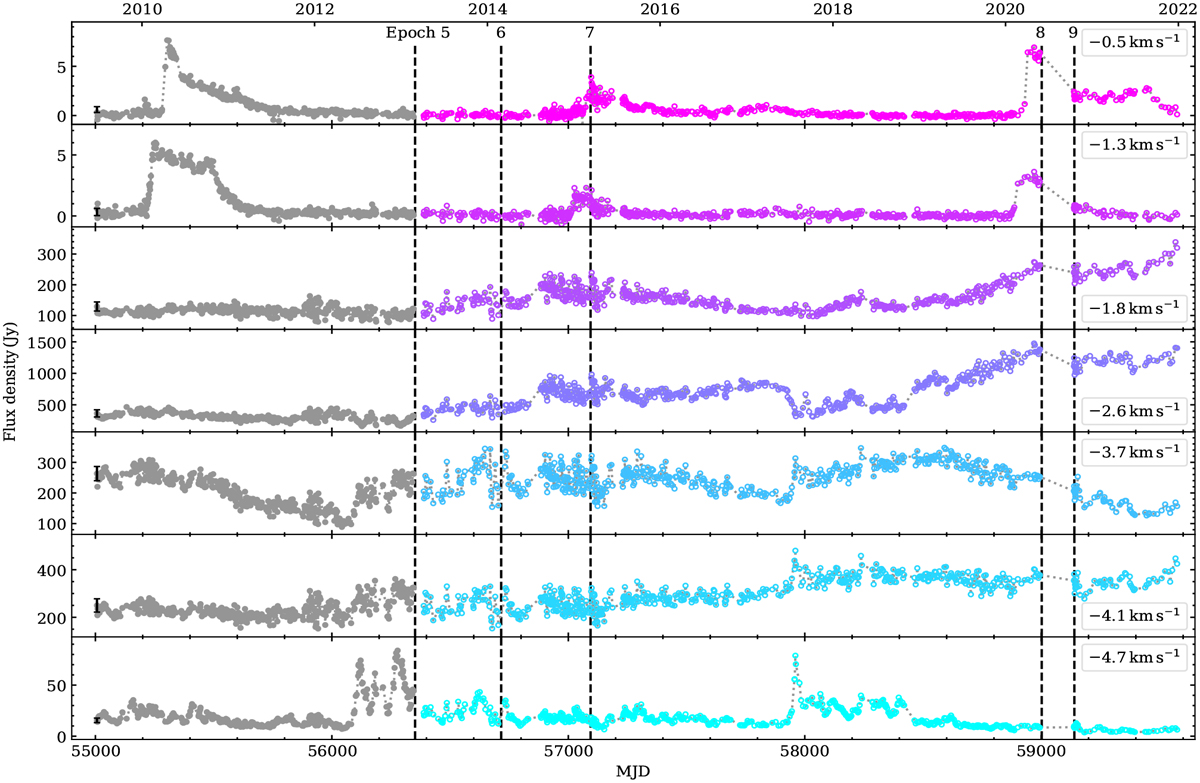
Light curves of the main spectral features of the 6.7 GHz transition in Сер AHW2. Data before MID 56 352 (grey dots) were published in (Szymczak et al. 2014). Typical measurement uncertainty is shown by the black bar for the first data point. The light curves were produced using single-dish data (Sect. 2.1) by averaging three channels; the velocity of the central channel is given for each panel. Colours indicate different spectral features at velocities given to the right of the plots. The vertical black dashed lines mark VLBI observations; epoch numbers correspond to those given in Table 1. VLBI observations at epochs 1–4 were performed before our single-dish monitoring started.
Current usage metrics show cumulative count of Article Views (full-text article views including HTML views, PDF and ePub downloads, according to the available data) and Abstracts Views on Vision4Press platform.
Data correspond to usage on the plateform after 2015. The current usage metrics is available 48-96 hours after online publication and is updated daily on week days.
Initial download of the metrics may take a while.