Fig. B.1
Download original image
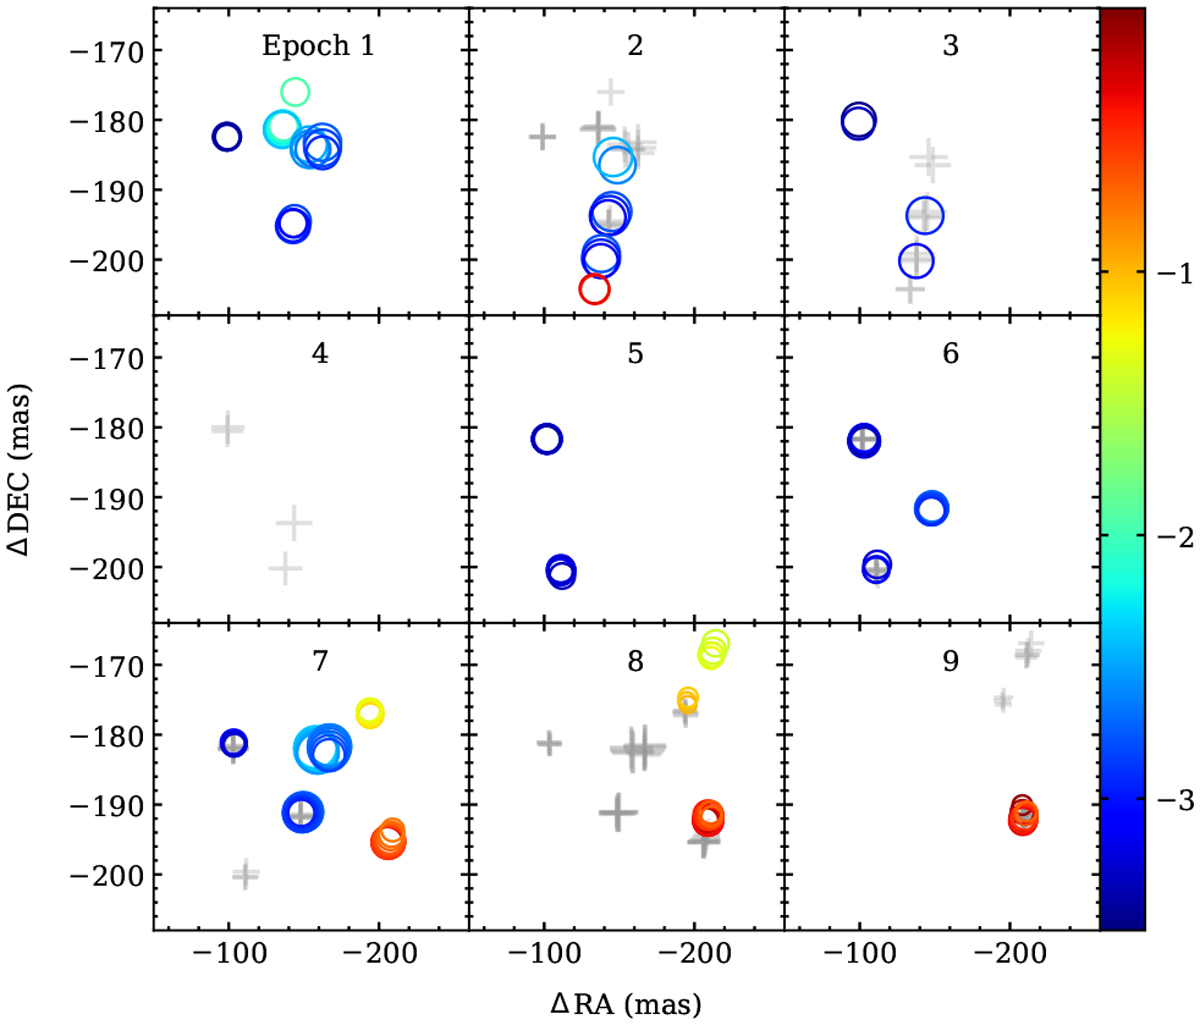
Spatial distribution of the CH3OH maser spots in Сер AHW2 in cluster II across nine epochs. Epoch numbers presented at the top of the graphs are listed in Table 1. The sizes of the symbols are proportional to the logarithm of the spot peak flux densities. Grey crosses denote the spatial distribution of the emission in the previous epoch.
Current usage metrics show cumulative count of Article Views (full-text article views including HTML views, PDF and ePub downloads, according to the available data) and Abstracts Views on Vision4Press platform.
Data correspond to usage on the plateform after 2015. The current usage metrics is available 48-96 hours after online publication and is updated daily on week days.
Initial download of the metrics may take a while.