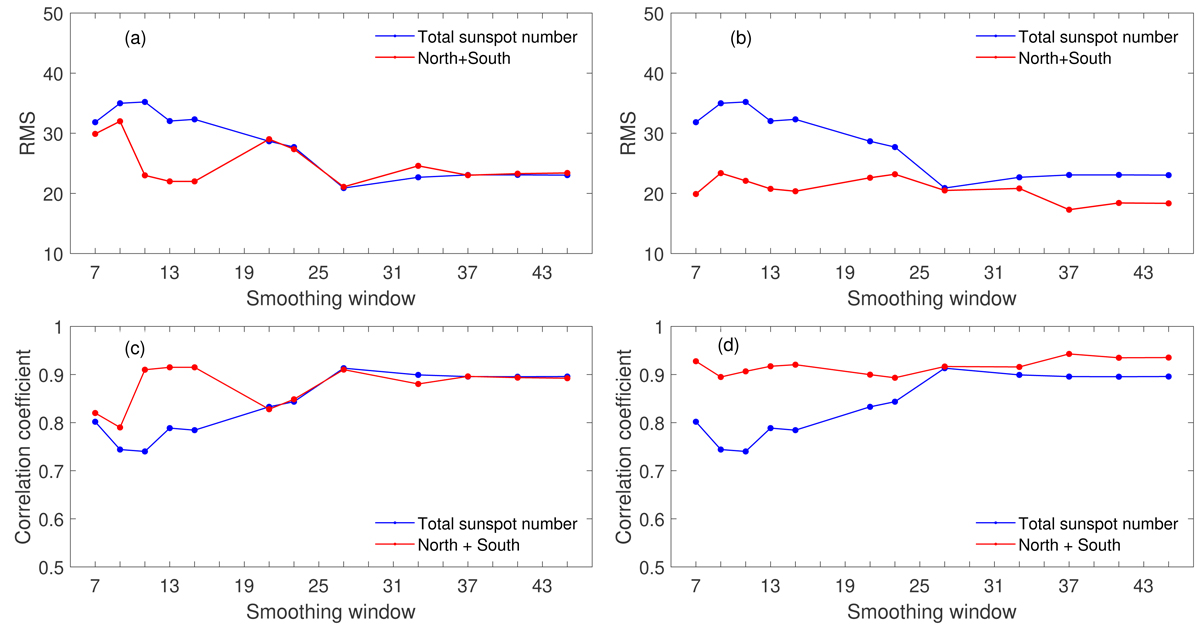
Fig. 8.
Download original image
Amplitude prediction performance of solar cycles 12–24 with the total (blue) and hemispheric (red) sunspot numbers for different smoothing windows (from 7 to 45 months). Top panels: rms errors of prediction. Bottom panels: correlation coefficient between true and predicted cycle amplitudes. Left (right) panels: prediction using the merged (full-proxy) hemispheric sunspot numbers.
Current usage metrics show cumulative count of Article Views (full-text article views including HTML views, PDF and ePub downloads, according to the available data) and Abstracts Views on Vision4Press platform.
Data correspond to usage on the plateform after 2015. The current usage metrics is available 48-96 hours after online publication and is updated daily on week days.
Initial download of the metrics may take a while.